Industrial capacity utilisation, first quarter 2024
Capacity utilisation in industry nearly unchanged
Statistical news from Statistics Sweden 2024-05-21 8.00
Capacity utilisation in industry increased by 0.2 percentage points in the first quarter of 2024 compared with the fourth quarter of 2023 in seasonally adjusted figures.
The increase in capacity utilisation in industry in the first quarter led to an increase in the level of utilisation, which amounted to 88.6 percent in seasonally adjusted figures.
On an annual basis, capacity utilisation decreased by 1.9 percentage points compared with the first quarter of 2023 and amounted to 88.7 percent in calendar adjusted figures.
The figures for the first quarter of 2024 are preliminary. Since the previous publication capacity utilisation in the fourth quarter of 2023 compared with the third quarter of 2023 remained unchanged with the utilisation rate at 88.4 percent, in seasonally adjusted figures.
Capacity utilisation in the third quarter of 2023 compared with the corresponding quarter a year ago has been revised downwards by 0.1 percentage points to a utilisation rate of 88.0 percent in calendar adjusted figures.
1) Calendar and seasonally adjusted figures 2) Calendar adjusted figures
New statistics: Reasons for Lower Capacity Utilisation
When businesses have a capacity utilisation rate of less than 100 percent, they must specify a primary reason for the lower capacity utilisation. The response options are fixed, and only one option can be selected. The shares of responses for each reason are distributed according to the diagram below. The responses are unweighted, unlike the capacity utilisation, which is weighted by industrial turnover.
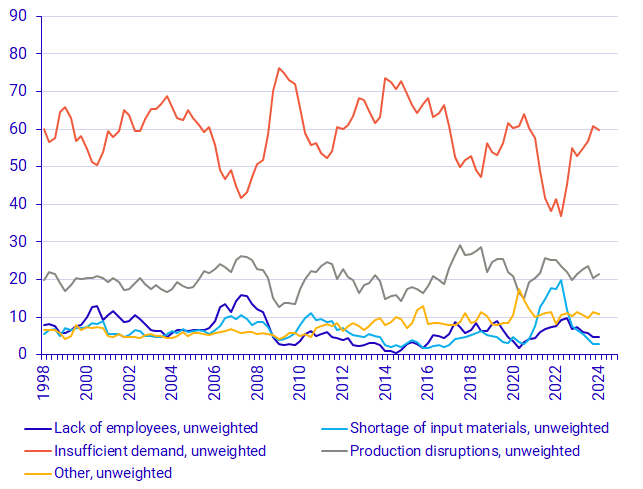
The reason that experienced the largest increase in shares compared to the previous quarter was production disruptions, which rose from 20.3 percent to 21.6 percent. The reason that primarily had the largest decrease in shares compared to the previous quarter was insufficient demand, which decreased from 60.9 percent to 59.8 percent.
Statistics on reasons for lower capacity utilisation are available in the statistical database with a time period stretching back to the first quarter of 1998. The purpose of the statistics is to better explain changes in capacity utilisation. Please note that this part of the statistics is under development and may change.
| Reason for lower capacity utilization | Shares | |||||||
|---|---|---|---|---|---|---|---|---|
| 2023 | 2024 | Q1 2024 - Q4 2023 | Q1 2024 - Q1 2023 | |||||
| Q1 | Q2 | Q3 | Q4 | Q1 | ||||
| Lack of employees | 7.3 | 6 | 5.7 | 4.6 | 4.7 | 0.1 | ‑2.6 | |
| Shortage of input materials | 6.7 | 5.6 | 4.1 | 2.8 | 3 | 0.2 | ‑3.7 | |
| Insufficient demand | 52.9 | 54.9 | 56.8 | 60.9 | 59.8 | ‑1.1 | 6.9 | |
| Production disruptions | 21.5 | 22.9 | 23.5 | 20.3 | 21.6 | 1.3 | 0.1 | |
| Other | 11.5 | 10.7 | 9.8 | 11.4 | 10.8 | ‑0.6 | ‑0.7 | |
Other information
Outdated tables
The table "Industrial capacity utilisation, actual utilisation by industrial classification SNI2007 (aggregates). Quarter 1990K1 - 2023K1" is no longer updated as of 2023-08-18. The reason for this is a reduced sample as a result of the increased use of VAT data for industry turnover. Consequently, since then, the industry's capacity utilisation has only been presented for the total industrial sector (B+C).
Revisions
When capacity utilisation for a new quarter is published, the percentages for the previous quarter are also revised. Normally, the figures for the previous quarter are revised mainly due to new and revised information.
Next publishing will be
2024-08-20 at 08:00.
Statistical Database
More information is available in the Statistical Database
Feel free to use the facts from this statistical news but remember to state Source: Statistics Sweden.