Party Preference Survey in November 2017 – Election today:
Political Party Preference Survey, November 2017
Statistical news from Statistics Sweden 2017-12-05 9.30
Statistics Sweden’s Party Preference Survey shows that if a Riksdag election were to be held in November then the government parties (S and MP) would receive 36.4 percent of the votes. The Alliance parties (C+L+M+KD) would receive 39.2 percent, the Sweden Democrats 14.8 percent, the Left Party 7.0 percent and other parties 2.6 percent of the votes.
A statistically significant decrease in total for the government parties is noted compared with the Riksdag election in 2014. The Social Democrats would receive 32.6 (±0.9) percent, while the Green Party would receive 3.8 (±0.4) percent if an election were to be held in November 2017.
No statistically significant change has been noted for the Alliance parties as a block, compared to the election in 2014. The Centre Party would receive 9.5 (±0.6) percent, the Liberal Party 4.2 (±0.4) percent, the Moderate Party 22.2 (±0.8) and the Christian Democrats 3.1 (±0.3) percent.
The Sweden Democrats would receive 14.8 (±0.7) percent, the Left Party 7.0 (±0.5) percent and other parties would receive 2.6 (±0.4) percent of the votes if there were an election in May. The Feminist Initiative Party is largest among other parties.
The proportion of those in the electorate who are uncertain is about 18 percent in November 2017.
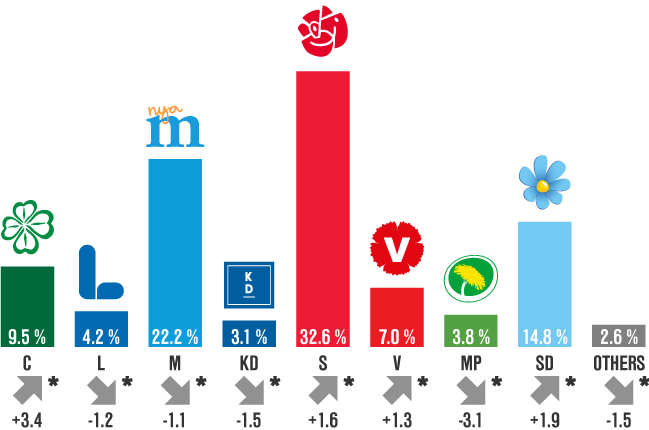
The change refers to comparisons with the 2014 Riksdag election in percentage points. Statistically significant changes are marked with an asterisk (*).
The table below presents the estimations of parties from November and May 2017 as well as the latest election results. Changes compared with the 2014 Riksdag election and Political Party Preference Survey in May 2017 are also presented. Statistically significant changes are marked with an asterisk (*).
Type of question: Which party would you vote for if an election were to be held in the next few coming days?
| Estimate November 2017 | Estimate May2017 | Change since May 2017 | Election 2014 | Change since election 2014 | ||||
|---|---|---|---|---|---|---|---|---|
| Party | Percent | Margin of error[1] | Percent | Margin of error[1] | ||||
| C | 9.5 | ±0.6 | 11.3 | ±0.6 | ‑1.8* | 6.1 | 3.4* | |
| L | 4.2 | ±0.4 | 5.0 | ±0.4 | ‑0.8* | 5.4 | ‑1.2* | |
| M | 22.2 | ±0.8 | 18.1 | ±0.7 | 4.1* | 23.3 | ‑1.1* | |
| KD | 3.1 | ±0.3 | 3.2 | ±0.4 | ‑0.1 | 4.6 | ‑1.5* | |
| S | 32.6 | ±0.9 | 31.1 | ±0.9 | 1.5* | 31.0 | 1.6* | |
| V | 7.0 | ±0.5 | 6.3 | ±0.4 | 0.7* | 5.7 | 1.3* | |
| MP | 3.8 | ±0.4 | 4.5 | ±0.4 | ‑0.7* | 6.9 | ‑3.1* | |
| SD | 14.8 | ±0.7 | 18.4 | ±0.8 | ‑3.6* | 12.9 | 1.9* | |
| other | 2.6 | ±0.4 | 2.2 | ±0.3 | 0.4* | 4.1 | ‑1.5* | |
1) Margin of error applies to estimations of both percentages and changes.
* The change is statistically significant.
A time series for the table above can be found in SCB:s Statistical database.
Definitions and explanations
The Party Preference Survey in November 2017 was conducted with a national random probability sample consisting of 8 919 persons entitled to vote in the Riksdag election, without an upper age limit. Answers are collected from these selected persons through telephone interviews and web questionnaires. A collection of answers through mixed mode was introduced for the first time in May 2015. The persons in the sample are offered the possibility to answer through a web questionnaire in the beginning of the collection period. If they have not replied via the web questionnaire, they have been contacted via telephone later on. As in the previous surveys, all available telephone numbers, both to mobile phones and home phones, have been used to contact the selected persons.
Of the sample persons, 23.9 percent could not be reached (including persons with unlisted telephone numbers and those without telephones), 3.1 percent were not able to participate and 20.1 percent did not want to be interviewed. The total non-response rate was 47.1 percent. The total number of respondents was 4 715. In addition, some persons did not want to answer certain questions. The data was collected during the period from 27 October to 28 November. A more detailed presentation of non-response will be made available in connection with the publication on 8 December.
The results are presented in intervals or point estimations ± margins of error. The interval that is created by the percent estimation ± margin of error here is a 95 percent confidence interval, which is an interval with a 95 percent probability including the actual value of the population, if no systematic errors occur.
Next publishing will be
The Political Party Preferences Survey and EU and euro preferences in November 2017, in total and in different demographic groups, will be published on 8 December at 09.30.
Statistical Database
More information is available in the Statistical Database
Feel free to use the facts from this statistical news but remember to state Source: Statistics Sweden.