Political Party Preference Survey in November 2022 - Political party preferences
Political party preferences in November 2022
Statistical news from Statistics Sweden 2022-12-07 8.00
The Political Party Preference Survey shows in which demographic groups the political parties have their greatest support. Political party preference does not refer to any specific political level and no account is taken of whether or not a person would vote. This survey also presents the EU, euro and NATO preferences of the electorate.
On 1 December, Statistics Sweden published estimates of election results, if an election had been held in November 2022. Based on the same survey, estimates of political party preferences in the electorate are presented here. Political party preference refers to the political party that a person prefers the most, which is not necessarily the same as the political party they would vote for in a parliamentary election.
The difference between the measurements is:
- Political Party Preference (preferred party) does not refer to any specific political level, such as parliamentary elections, and no account is taken of whether or not a person would vote.
- The “Election Today” estimate refers to the results of an election in November. These calculations of the results take into account whether or not the person would vote.
Political party preferences are compared below with election results in a hypothetical parliamentary election in November 2022.
|
Party preference |
"Election today" |
|||
|---|---|---|---|---|
| Party | Percent | Margin of error | Percent | Margin of error |
|
C
|
5.3 | ±0.5 | 5.4 | ±0.5 |
|
L
|
4.9 | ±0.6 | 4.1 | ±0.5 |
|
M
|
19.4 | ±1.0 | 18.9 | ±0.9 |
|
KD
|
5.0 | ±0.5 | 4.9 | ±0.5 |
|
S
|
32.8 | ±1.2 | 34.6 | ±1.2 |
|
V
|
8.2 | ±0.8 | 7.6 | ±0.8 |
|
MP
|
4.6 | ±0.5 | 4.4 | ±0.5 |
|
SD
|
18.1 | ±0.9 | 18.2 | ±0.8 |
|
Other
|
1.6 | ±0.4 | 1.9 | ±0.4 |
The table appendix of the Political Party Preference Survey November 2022 publication presents political party preference among different groups in the population of eligible voters.
Political party preferences in November 2022
Centre Party (C)
In November 2022, 5.3 ± 0.5 percent of eligible voters stated that they prefer the Centre Party the most. This is a statistically significant decrease compared with May 2022 (6.6 ± 0.7 percent).
Liberal Party (L)
In November 2022, 4.9 ± 0.6 percent of eligible voters stated that they prefer the Liberal Party. This is a statistically significant increase compared with May 2022 (3.6 ± 0.5 percent).
Moderate Party (M)
In November 2022, 19.4 ± 1.0 percent of eligible voters stated that they prefer the Moderate Party the most. This is a statistically significant decrease compared with May 2022 (21.4 ± 1.2 percent).
Christian Democrats (KD)
In November 2022, 5.0 ± 0.5 percent of the electorate stated that they prefer the Christian Democrats. This is not a statistically significant change compared with May 2022 (5.1 ± 0.6 percent).
Social Democratic Party (S)
In November 2022, 32.8 ± 1.2 percent of the electorate stated that they prefer the Social Democratic Party the most. This is not a statistically significant change compared with May 2022 (33.0 ± 1.3 percent).
Left Party (V)
In November 2022, 8.2 ± 0.8 percent of eligible voters stated that they prefer the Left Party. This is not a statistically significant change compared with May 2022 (8.4 ± 0.8 percent).
Green Party (MP)
In November 2022, 4.6 ± 0.5 percent of eligible voters stated that they support the Green Party. This is a statistically significant increase compared with May 2022 (3.4 ± 0.6 percent).
Sweden Democrats (SD)
In November 2022, 18.1 ± 0.9 percent of eligible voters stated that they prefer the Sweden Democrats the most. This is a statistically significant increase compared with May 2022 (16.5 ± 1.0 percent).
EU and euro preferences
The proportion of those who stated that they are mainly in favour of Sweden’s EU membership was 60.3 ± 1.7 percent in November 2022. The percentage of persons who are opposed to EU membership was 13.5 ± 1.2 percent, and the percentage of persons who did not have an opinion was 26.3 ± 1.6 percent.
Compared with May 2022, there has been a statistically significant decrease in the proportion of those who state that they are in favour and a significant increase of those who are opposed to and those who did not have an opinion to EU membership.
If a referendum on the euro was held in November 2022, 23.2 ± 1.5 percent would vote yes to the euro, and 58.5 ± 1.8 percent would vote no, while 18.3 ± 1.4 percent stated that they do not know how they would vote. This is not a statistically significant change compared with May 2022.
The following questions were asked: Are you mainly in favour of or opposed to Sweden’s EU membership, or do you not have any firm opinion? If a referendum was held today to replace the Swedish krona as a currency, would you vote “yes” or “no” with regard to introducing the euro as Sweden’s currency?
See the Statistical Database in the link below for EU and euro preferences presented by region, foreign/Swedish background, civil status, children, income, type of housing, employment, socio-economic group, sector and trade union affiliation.
NATO preferences
In November 2022, 28.9 ± 1.5 percent of eligible voters stated that they were very positive towards a Swedish NATO membership, 38.9 ± 1.7 percent quite positive, 13.0 ± 1.2 percent quite negative, and 8.9 ± 1.1 percent stated that they were very negative. 10.2 ± 1.2 percent of eligible voters stated that they did not know/did not want to answer the question.
Compared with May 2022, there has been a statistically significant increase in the proportion of those who state that they are very positive towards a Swedish NATO membership, and a statistically significant decrease in the proportion of those who state that they do not know/do not want to answer the question.
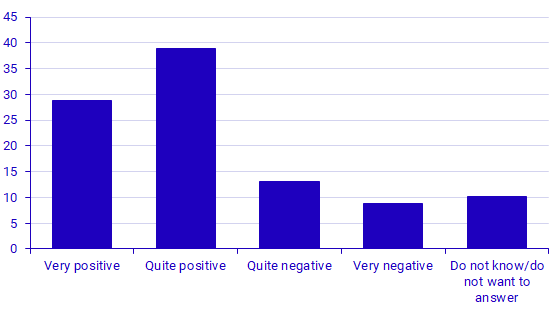
The following question was asked: Are you positive or negative towards a Swedish membership in NATO?
| Very positive | Quite positive | Quite negative | Very negative | Do not know/do not want to answer | ||||||
|---|---|---|---|---|---|---|---|---|---|---|
| % | ± | % | ± | % | ± | % | ± | % | ± | |
| Women | 22.6 | ±2.0 | 41.9 | ±2.5 | 14.5 | ±1.8 | 7.6 | ±1.4 | 13.3 | ±1.9 |
| Men | 35.4 | ±2.2 | 35.9 | ±2.3 | 11.4 | ±1.6 | 10.3 | ±1.6 |
7.1 |
±1.6 |
| Total | 28.9 | ±1.5 | 38.9 | ±1.7 | 13.0 | ±1.2 | 8.9 | ±1.1 | 10.2 | ±1.2 |
Definitions and explanations
The Party Preference Survey in November 2022 was conducted with a national random sample consisting of 9 177 persons entitled to vote in a parliamentary election, without any upper age limit. Answers from these people are collected through telephone interviews and online questionnaires. As in previous surveys, all available telephone numbers, both to mobile phones and fixed phones, have been used to contact the selected persons.
Among the sample persons, 30.7 percent could not be reached, 2.4 percent were unable to participate, and 22.6 percent did not wish to be participate. The total non-response rate was 55.6 percent. The total number of respondents was 4 070, which corresponds to 44.4 percent. A more detailed presentation of non-response is available in table 23 of the publication “Political Party Preference Survey November 2022”.
The data was collected during the period from 27 October to 24 November.
The results are presented in the form of point estimates ± margins of uncertainty. The interval that is formed by the percent estimate ± margin of uncertainty here is a 95 percent inaccuracy interval, which is an interval that, with 95 percent confidence, includes the actual value of the population, if there are no systematic errors.
Publication
In the table appendix of the publication, results are also presented by region, foreign/Swedish background, civil status, children, income, form of housing, occupation, socio-economic group, sector and union membership.
Next publishing will be
The estimate of May 2023 parliamentary election results will be published on 1 June 2023.
Political party preferences and EU, euro and NATO preferences in May 2023 will be published on 7 June 2023.
Feel free to use the facts from this statistical news but remember to state Source: Statistics Sweden.