More people pursuing further studies after completing their education in the covid-19 pandemic
Statistical news from Statistics Sweden 2022-03-30 8.00
The proportion of people who worked the year after upper secondary school, higher vocational education and higher education declined in 2020. Instead, a higher proportion of people continued studying. In contrast to the financial crisis, the proportion of upper secondary school leavers who neither worked nor studied remained low.
This is shown by new statistics on employment and income after completed education from Statistics Sweden. These statistics include upper secondary school leavers and graduates from higher education and higher vocational education. The measurement is made in a way that makes the forms of education comparable.
Key findings
- The proportion of upper secondary school leavers who worked the year after leaving school fell sharply during the covid-19 pandemic, while at the same time the proportion who studied increased to a corresponding extent. The proportion who neither worked nor studied the year after upper secondary school remained low.
- There was a slight downturn in the proportion who worked the year after graduating from higher vocational education and higher education. Instead, the proportion of people who continued to study increased.
- Among graduates from higher vocational education, the proportion of people who neither worked nor studied increased during the covid-19 pandemic. The corresponding proportion was unchanged among higher education graduates.
- Looking at graduates who worked the year after completing their education, average annual earned income growth was lower among men than among women during the pandemic. This applies to all three forms of education.
Most common to start work after higher vocational education
The majority of graduates from higher vocational education and higher education leave studying and start to work. Out of the 14,100 people who graduated from higher vocational education in 2018/19, 81 percent were working in the autumn of 2020. 12 percent continued studying, either within higher vocational education or another form of education. The pattern was more or less the same for women as men.
Out of the 54,400 graduates from higher education in 2018/19, 77 per cent were working in the autumn of 2020. Compared with higher vocational education, a higher proportion continued to study (20 percent). This mainly includes people who go on to pursue advanced studies after their bachelor’s degree. There were around double the number of women than men who graduated from higher education in 2018/19, but it is more common for men to continue studying after graduating. This is largely because many more women than men attend briefer vocational courses, such as in nursing, preschool teaching or social work.
Among upper secondary school leavers, work and continuing studies are more or less equally common. Out of the 84,400 people who graduated from upper secondary school with a qualification or study certificate in 2018/19, 49 percent of men and 42 percent of women worked. Among women, it was instead more common to continue studying, or to both work and study.

More studying and fewer working among upper secondary school leavers in the covid-19 pandemic
The proportion of upper secondary school leavers who work the year after leaving school has declined in the past few years. The decline started already in 2018. Instead, the proportion studying, or both working and studying, has increased. Out of men, in the autumn of 2020 around half were working and around 40 percent were studying, or both studying and working. Out of women, a lower proportion were working (around 40 percent) and a higher proportion were studying or both studying and working (around half). There was a similar pattern after the 2008 financial crisis. At that time, there was a sharp drop in the proportion working and a slight increase in the proportion studying.
During the financial crisis, there was a sharp increase in the proportion neither working nor studying, particularly among men. Such a progression is not visible for 2020. While the proportion neither working nor studying indeed increased among men, the increase is small and started already in 2018. Among women, the proportion decreased.

Slight downturn in the proportion who worked the year after graduating from higher education
Out of higher education graduates too, the proportion of people who finished studying and started to work decreased, although the decline was much smaller compared with upper secondary school. Out of those who graduated from higher education in 2017/18, 79 percent of women and 76 percent of men were working in the autumn of 2019. For 2018/19 graduates, 77 percent of the women and 73 percent of the men were employed in the autumn of 2020. It was a similar decline to that following the 2008 financial crisis. Just like after the financial crisis, the proportion of people who continued to study increased instead. The proportion neither working nor studying has not been affected during the covid-19 pandemic, although it increased somewhat in the wake of the financial crisis, particularly among men.

Greater proportion who continued studying after higher vocational education
After completing higher vocational education, most people start to work. Out of graduates in 2017/18, 87 percent of women and 86 percent of men were working in the autumn of 2019. The proportion who continued to study was 8 percent among both women and men. Out of the 2018/19 graduates, a lower proportion were working the following year – 82 percent of women and 80 percent of men. Instead, there was an increase in the proportion who continued to study and the proportion who neither worked nor studied.
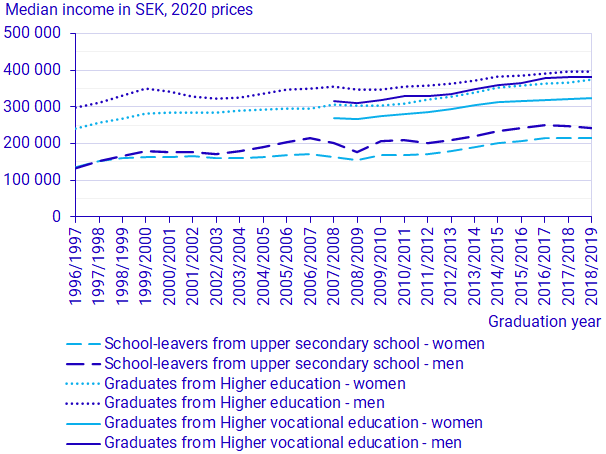
 in the year following graduation year in 2020 prices, by form of education and sex. Upper secondary school leavers and higher education graduates 1996/97–2018/19, and higher vocational education graduates 2007/08–2018/19")
Poorer income growth among men during the pandemic
Average annual earned income in the year following completed education is highest among male higher education graduates. Female higher education graduates, and male higher vocational education graduates, are just below this level. Female higher vocational education graduates have on average lower annual earned income, albeit much higher than that of upper secondary school leavers. Also among upper secondary school leavers, men have higher annual average earned income than women.
A comparison of 2017/18 graduates and their annual income in 2019, with 2018/19 graduates and their annual income in 2020, shows that income growth during the covid-19 pandemic has come to a halt for men, but not for women. Men who left upper secondary school in 2018/19 even had lower average annual income than men who left upper secondary school one year before.
Statistical Database
The statistical database presents four tables per form of education (upper secondary school, higher vocational education and higher education):
- Statistics on the number of people working or studying
- Statistics on the number of people who are employed or self-employed (professional status)
- Income distribution with distribution metrics
- Income distribution as number of people in different income ranges.
For higher vocational education, there is also a table containing regional data.
Definitions and explanations
Who the statistics include
Upper secondary school
Upper secondary schools underwent a reform in 2011. Prior to that, the curriculum from 1994 applied. A new curriculum has been in place since 2011. Comparisons in findings for school leavers from the old and the new upper secondary school must be made with caution. In order to create comparability over time, the group “leavers” is defined as students with final grades from upper secondary school until 2012/13 inclusive, and leavers with a qualification or study certificate of at least 2,500 credits from 2013/14.
Higher vocational education
Graduates from higher vocational education refers to admitted students who have fulfilled all conditions for the qualification. Until the 2017/18 academic year, graduates were presented based on the final year of a programme session. This means that people who have not completed their education at the end of the programme session, who take late supplementary measures before fulfilling the qualification requirements, are nevertheless presented based on when the programme session ended. From the 2018/19 academic year, the actual date of obtaining the qualification for each graduate is used to define the academic year.
It occurs that people obtain several qualifications during one academic year. For these, a prioritisation has been made such that they are only presented once per academic year. If a person has a qualification from several programmes in the same academic year, the longer programme is chosen.
Note that higher vocational education does not follow any breakdowns into terms or academic years. The presentation by academic year has been created for the sake of compatibility with the other forms of education.
Higher education
Higher education graduates include (1) all people who, in the academic year concerned, have been awarded a diploma and earned higher education credits in the same academic year; and (2) all people who have earned credits in the academic year concerned, but who were not awarded the diploma until the following term. People who have waited longer than one term to obtain their diploma following completed studies are not included. Incoming students from abroad are not included either.
How we measure employment
“Employment” refers to employment status in November according to the register-based labour market statistics, the studying population in the autumn term according to the Studying Population Register, and population registration data at 31 December of the year concerned according to the Total Population Register.
As of the 2019 reference year, a new data source is used (monthly employer returns at the individual level) and a method for classifying who is in work. Studies performed on the effect of this change on the labour market statistics generally indicate an increase in the proportion who are working with the new procedure. For example, people who have received a low salary payment, and who therefore probably do not work to such a great extent, have been classified as working if they received a payment in November. This means for example that the proportion of those working out of younger people is higher compared with the former procedure. Comparisons of statistics for 2019 and previous reference years must be made with great caution.
How we measure income
Earned income is not the same as salary. Earned income (that is, income earned from work) is affected by how much of the year a person has worked, absence from work, part-time and full-time employment and compensation for overtime. Income therefore shows a combination of how much a person has worked, and the size of their salary.
Total earned income consists of income from employment and income from business activity. Income from employment includes, besides income from salary, also income from pension, sick pay and other taxable compensation from, for instance, the Swedish Social Insurance Agency.
Next publishing will be
March 2023.
Feel free to use the facts from this statistical news but remember to state Source: Statistics Sweden.