Men earn the same pay after an upper secondary vocational programme as women after three years in higher education
Statistical news from Statistics Sweden 2021-03-29 9.30
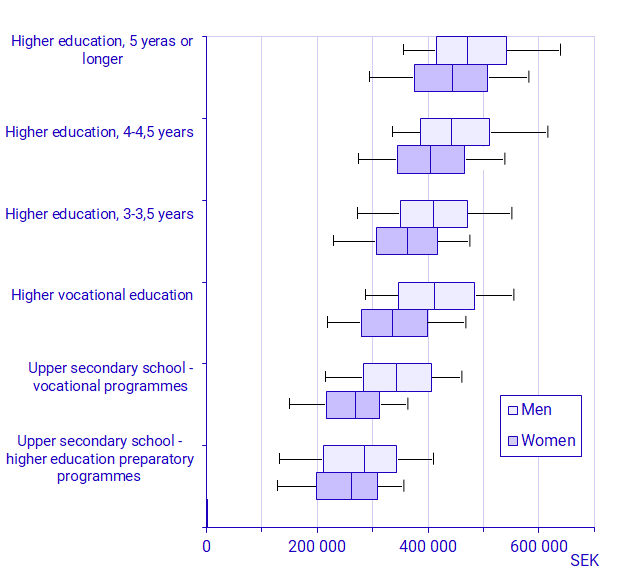
Incomes increase with the level of academic degree, according to new statistics on work after different education programmes. Three years after graduation, the highest incomes are among those who studied higher education programmes that were five years or longer. Across all groups, women had lower incomes than men.
The forms of education that are examined are upper secondary school, higher vocational education and higher education. Here, we present statistics for graduates in 2015/16 and their incomes in 2019. The Statistical Database contains statistics on graduates from 1996/97 to 2017/18 and their employment and income one, three, five and ten years after graduation.
Three years after graduation from upper secondary school, higher vocational education or higher education in 2015/16, the figures show the following: for women who did not pursue studies after upper secondary school, it is largely insignificant for their income whether they have a diploma from a vocational programme or a higher education preparatory programme. Men with a diploma from a vocational programme, on the other hand, have a considerably higher income than those with a diploma from a higher education preparatory programme. This is because a number of vocational programmes in upper secondary school with predominantly men lead to relatively high incomes.
For both women and men, the income increases with the length of their higher education. However, differences between women and men are present in all groups, although they diminish somewhat as the length of the education increases.
Men with a diploma from an upper secondary vocational programme and women with a degree from higher vocational education (in which programmes are two years long on average) or with a degree from a 3-3.5 year long higher education programmes have equally high incomes.
For both women and men, incomes are roughly the same after higher vocational education programmes and after 3-3.5 years of higher education programmes.

Graduates from upper secondary school only include those who did not study further after upper secondary school.

Fraction of employees with equal or lower salary than the measure:
- 10:th percentile 10 percent
- 25:th percentile 25 percent
- 50:th percentile 50 percent
- 75:th percentile 75 percent
- 90:th percentile 90 percent
Many people get a job directly after upper secondary school
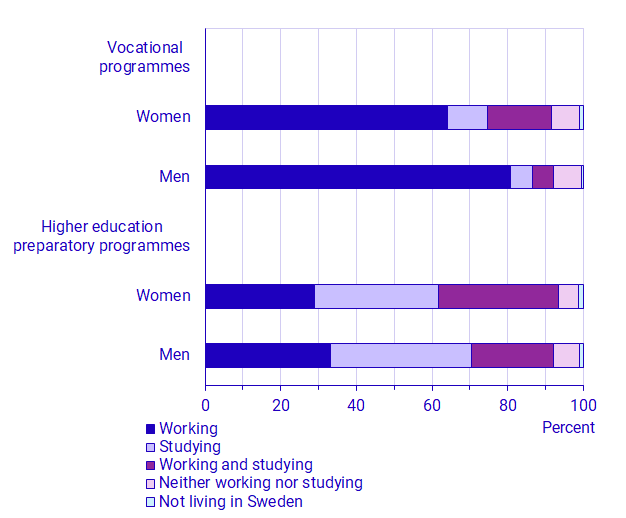
Many young people do not study further directly after upper secondary school. Three years after graduation in 2015/16, 64 percent of the women and 81 percent of the men with a diploma from a vocational programme are in work. Among women 27 percent are studying, and among men this figure is 12 percent. It was common to combine work and studies. Among graduates from higher education preparatory programmes, further studies were considerably more common and many people in this group also combined work with studies. However, about one third only worked.

The statistics in the table below shows how many people who obtained a diploma in 2015/16 and who were only working in 2019. People who both worked and studied are not included. The largest group consists of women with a degree from 3-3.5 year-long higher education programmes. The smallest group consists of men with a degree from 4-4.5 year-long higher education programmes.
| Group | Total | Women | Men |
|---|---|---|---|
| Examinerade från gymnasieskolan som inte läst vidare - högskoleförberedande program | 11 455 | 5 815 | 5 640 |
| Examinerade från gymnasieskolan som inte läst vidare - yrkesprogram | 16 995 | 6 055 | 10 940 |
| Yrkeshögskolan | 11 125 | 6 240 | 4 885 |
| Högskoleutbildning 3 - 3,5 år | 25 295 | 17 680 | 7 615 |
| Högskoleutbildning 4 - 4,5 år | 7 845 | 5 705 | 2 140 |
| Högskoleutbildning 5 år och mer | 8 940 | 4 835 | 4 105 |
Statistical Database
In the Statistical Database there are four tables per form of education (upper secondary school, higher vocational education and higher education):
- Statistics on the number of people working or studying as shown in the figure above.
- Statistics on the number of people who are employed or self-employed (employment status).
- Income distribution with distribution measures as shown in the figure above
- Income distribution as a number of people in different income intervals.
Definitions and explanations
Income from work is not the same as salary and wages. Earned income, that is, income from employment, is affected by the proportion of the year during which the person was in work, absent from work, full time or part time work, and factors such as overtime compensation. This is why income is a combination of how much the person worked and the level of their salary.
Total earned income consists of income from employment and income from business. In addition to earned income, income from employment also includes income from pension, sickness benefit and other taxable compensations from authorities such as the Swedish Social Insurance Agency.
Income distribution: the outermost lines show the 10th and 90th percentiles, respectively. The outer edges of the boxes show the 25th and 75th percentiles and the line inside the box shows the median income. Examples of women with a diploma from a higher education preparatory programme who did not study further after upper secondary school:
Ten percent had an income up to SEK 126 800 in 2019 and 90 percent had a higher income. Twenty-five percent had an income up to SEK 199 300 and 75 percent had a higher income. Fifty percent had an income below and fifty percent had an income above SEK 261 100 (median). Seventy-five percent had an income below SEK 308 000 and 25 percent had a higher income. Ninety percent had an income below and 10 percent had an income above SEK 355 000.
Graduates from higher education include (1) all persons who have received a diploma certificate in the current academic year and who have completed higher education credits in the same academic year and (2) all persons who have completed credits in the current academic year, but received their diploma certificate a semester later. People who have waited longer than one semester to obtain the diploma certificate after completing their studies are not included. International students are also not included.
Next publishing will be
March 2022.
Feel free to use the facts from this statistical news but remember to state Source: Statistics Sweden.
