Research and Experimental development in the Business enterprise sector 2017
R&D activities increased among Swedish enterprises
Statistical news from Statistics Sweden 2018-11-21 9.30
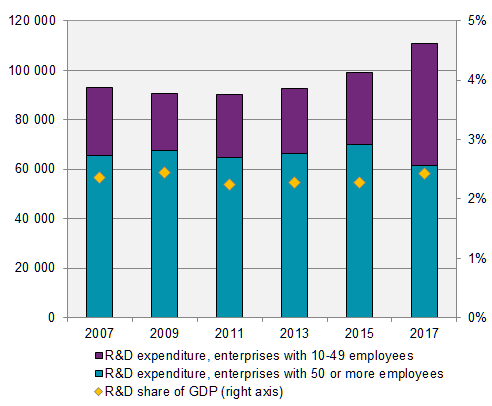
Intramural R&D in Swedish enterprises increased in 2017 compared with 2015. According to the outcome of the 2017 survey, expenditure on intramural R&D amounted to SEK 111 billion in 2017, up by 12 percent compared with 2015. Time spent by enterprises’ employees on R&D, measured in full-time equivalents, also increased.
Expenditure on intramural R&D increased by SEK 11.8 billion compared with 2015, in constant 2017 prices. Expenditure as share of GDP rose from 2.26 percent to 2.42 percent. The share of activity accounted for by the goods-producing part of the sector shifted from 70 percent to 55 percent.

Ahead of the 2017 survey, the OECD definition of R&D was revised. This definition is used worldwide in the production of R&D data. There is reason to believe that the implementation of the new definition has caused some enterprises to rethink their assessment of their R&D performance, compared with the 2015 survey.
The increase in expenditure coincided with a shift in a large part of the expenditure from the goods-producing part of the sector to the service-producing part. This is due to a change in the population. This change is reflected in the figure above and in the table below.
| NACE rev. 2 | 2013 | 2015 | 2017 | |
|---|---|---|---|---|
| 01-99 | All industries | 92 570 | 99 112 | 110 933 |
| 01-43 | Goods-producing enterprises | 66 254 | 69 936 | 61 684 |
| 25-28 | Manufacture of fabricated metal products, except machinery and equipment, Manufacture of computer, electronic and optical products, Manufacture of electrical equipment, Manufacture of machinery and equipment n.e.c. | 29 892 | 31 845 | 15 773 |
| 29-30 | Manufacture of motor vehicles, trailers and semi-trailers, Manufacture of other transport equipment | 19 520 | 21 079 | 29 303 |
| 45-99 | Service-producing enterprises | 26 317 | 29 175 | 49 249 |
| 45-47+55-56 | Wholesale and retail trade and repair of motor vehicles and motorcycles, Wholesale trade, except of motor vehicles and motorcycles, Retail trade, except of motor vehicles and motorcycles, Accommodation, Food and beverage service activities | 5 683 | 5 965 | 7 060 |
| 58-63 | Publishing activities, Motion picture, video and television programme production, sound recording, and music publishing activities, Programming and broadcasting activities, Telecommunications, Computer programming, consultancy and related activities, Information service activities | 4 871 | 6 477 | 21 862 |
| 71 | Architectural and engineering activities; technical testing and analysis | 2 066 | 2 351 | 2 975 |
| 72 | Scientific research and development | 9 424 | 9 607 | 12 271 |
In terms of time spent on R&D by employees, measured in full-time equivalents (FTE), R&D activity is up by roughly 10 percent compared with 2015. As with the expenditure, this increase may be affected, in part, by the new definition.
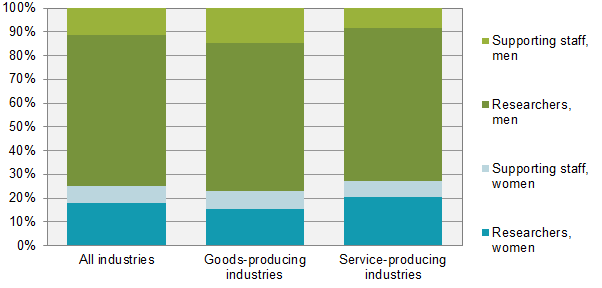
The distribution of men and women in businesses’ R&D activities has remained unchanged since 2007. Then, as now, the share of FTEs carried out by women is roughly 25 percent. With regard to the occupation researcher, the share is even lower – roughly 22 percent. Although the share of FTEs carried out by women is slightly higher among service-producing enterprises, only a small part of all sub-industries are gender equal according to the 40/60 rule.

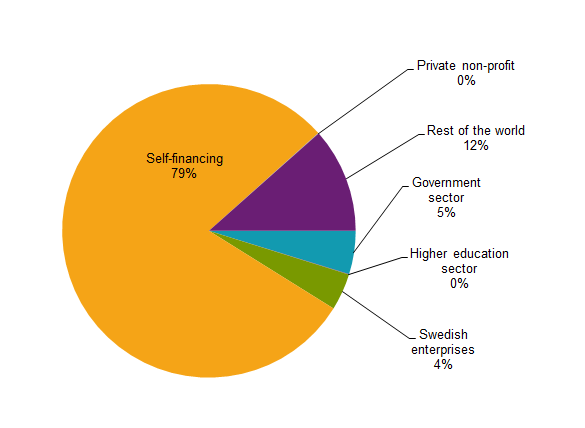
Companies use various sources to fund their R&D expenditure. These sources have remained relatively stable over time, although the share of enterprises’ own funding has increased slightly since 2015. The share of funding from other enterprises in Sweden has decreased.

Definitions and explanations
Important information
Information on the revision of the OECD definition of R&D can be found in the Frascati Manual 2015.
All R&D statistics are based on the concept and definitions in this manual.
For more information, or if you have questions on the results, please contact us.
Statistical Database
More information is available in the Statistical Database
Feel free to use the facts from this statistical news but remember to state Source: Statistics Sweden.
