Environmental accounts – Emissions to air 2022
Greenhouse gas emissions from the Swedish economy decreased by 3 percent in 2022
Statistical news from Statistics Sweden 2024-04-04 8.00
Greenhouse gas emissions from Sweden’s economy decreased by 3 percent in 2022 to 49 million tonnes of carbon dioxide equivalents compared with 2021. The transport sector is the only economic sector that went against this trend and increased its emissions. Over the same period GDP increased by 2,5 percent. Therefore, the emission intensity is decreased by 5 percent during the year 2022.
In 2022 greenhouse gas emissions from the Swedish economy amounted to 49 million tonnes of carbon dioxide equivalents. This is decrease of 1,5 million tonnes of carbon dioxide equivalents compared with the previous year.
Between 2008 and 2022, greenhouse gas emissions from Sweden's total economy decreased by 27 percent. During the same period, GDP grew by 31 percent, which led to reduced emission intensity by 45 percent during the time series. Greenhouse gas emissions followed the economic trend between 2008 and 2010. However, in the following years, the emisssions largely decreased, while the economy kept growing, leading to a reduction in emission intensity.

*2022 GDP at constant prices 2015 is preliminary. Source: Statistics Sweden, Environmental accounts and National accounts
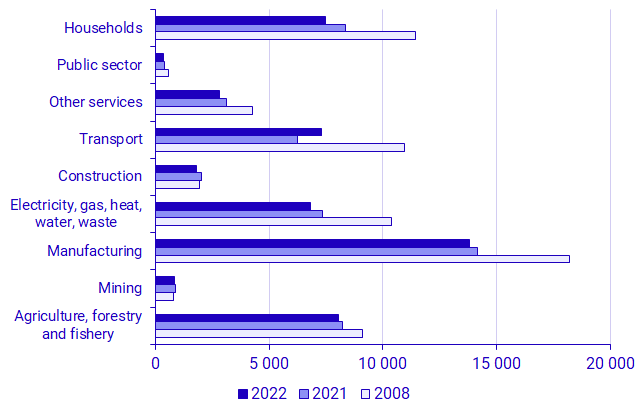
Greenhouse gas emissions decreased in all sectors except the transport sector
Greenhouse gas emissions decreased mainly in the construction sector and the households in 2022 compared with 2021. The construction sector and the households decreased their emissions by 10 percent. The transport sector was the only one which did not follow the same trend and instead, increased its emissions by 16 percent in 2022 compared with 2021. The transport sector’s emissions include emissions from the aviation industry, maritime transport and road haulage. The aviation industry was the main cause of this increase as its emissions were 70 percent higher that the previous year. However, they are emissions from the aviation industry are still lower than the pre-pandemic levels. It is worth noting that the aviation industry was the most affected by the covid-19 pandemic. In comparison to 2019, the emissions from aviation were 2 percent lower.
Regarding the other sectors, namely, the public sector, mining, the energy sector, and agriculture, forestry and fishing, the emissions reduced, which contributed to the overall change.
Source: Statistics Sweden, Environmental accounts.
Emissions from biofuels unchanged
Emissions from the use of biofuels, such as wood, biogas, food, and other, are reported as biogenic carbon dioxide emissions according to international regulations and therefore, they are not counted as a part of the total greenhouse gas emissions.
In 2022, carbon dioxide emissions from biogenic fuels were 53,8 million tonnes. Biogenic carbon dioxide emissions occur mainly in the energy sector and the manufacturing sector, where a lot of stationary fuel combustion takes place. The total increase in carbon dioxide emissions from biogenic fuels has been 34 percent since 2008. In 2022, the energy sector reduced its biogenic emissions, while all other sectors increased theirs. However, overall the emission level was unchanged between 2021 and 2022. The energy sector and the manufacturing sector accounted for 80 percent of the total biogenic carbon dioxide emissions. In comparison, the same sectors accounted for 47 percent of the total greenhouse gas emissions in 2022.
In sectors where the emissions are mainly a result of use of work machines and transport means, like in mining, construction and transport industry, biogenic carbon dioxide emissions are relatively low.

Source: Statistics Sweden, Environmental accounts
Use the analytical tool for environmental economic data
Environmental accounts data is available via an analytical tool online that combines data from the Environmental Accounts and economic data. This tool can be used to explore emissions statistics from both production and consumption perspectives along with other environmental economic data. The tool is available on the Environmental Accounts’ webpage (www.scb.se/mi1301). Using the tool, you can generate your own indicators, compare environmental pressures from different industries and study the relationship between demand in the economy, energy use, and emissions.
Definitions and explanations
The Environmental Accounts present national environmental statistics and economic statistics in a common framework using NACE industry classification. This makes it possible to analyse the relationship between the economy and the environment. The starting point for the Environmental Accounts is the environmental impact of Swedish economic actors, regardless of where in the world their emissions occur.
These statistics on emissions to air are based on a production perspective. Emissions are reported by industry in which the emissions occur, including households’ direct emissions (i.e. combustion of fossil fuels, heating and other direct emissions). Indirect emissions from imports and other consumption of goods and services are not included.
Statistics on emissions to air published by the Swedish Environmental Protection Agency cover territorial emissions, i.e. emissions that occur within Sweden’s borders. Sectors are disaggregated by emissions category (process), rather than by industry. Emissions and uptake from land use and land use change are included, while emissions from international aviation and navigation are reported separately. See also, Climate Transition (naturvardsverket.se)
The difference between the Swedish Environmental Protection Agency's statistics with a territorial perspective and the Environmental Accounts' statistics with a production perspective is that the latter excludes emissions caused by foreign companies within the Swedish borders, but includes emissions caused by Swedish companies abroad.
Adjusting data sources produced from a territorial perspective to a production perspective – as reported in Environmental accounts – on economic residence is called a residence adjustment.
Greenhouse gas emissions – carbon dioxide equivalents are calculated as an aggregate of CO2 (fossil), CH4, N2O, HFC, PFC, SF6. The conversion factors (Greenhouse Warming Potential, GWP) used to calculate carbon dioxide equivalents are the same as those used for reporting to UNFCCC.[1]
[1] IPCC, 2014: Climate Change 2014: Synthesis Report. Contribution of Working Groups I, II and III to the Fifth Assessment Report of the
Intergovernmental Panel on Climate Change [Core Writing Team, R.K. Pachauri and L.A. Meyer (eds.)]. IPCC, Geneva, Switzerland, 151 pp, AR5 Synthesis Report - Climate Change 2014 (ipcc.ch)
Revisions
A number of revisions have been applied since the previous publication:
- The emissions from use of work machines and road transportation as well as the emission factors of fuels used in stationary fuel combustion have been changed due to revisions made in the IPCC's Assessment Report. Revisions have been also made in the calculation of fossil emissions that derive from waste management.
More information on these updates is available in the webpage Miljöräkenskaper (scb.se) under the heading Documentation.
Next publishing will be
The next item of statistical news on quarterly emissions to air will concern the fourth quarter of 2023 will be published on 2024-05-23 at 08.00. Preliminary annual statistics on 2023 will also be published at this time.
The next statistical news on annual emissions to air, 2008–2023 (final statistics) is scheduled for publication in spring 2025.
Please feel free to use facts from this item of statistical news, but remember to cite as Source: Statistics Sweden.
Statistical Database
More information is available in the Statistical Database
Feel free to use the facts from this statistical news but remember to state Source: Statistics Sweden.