Environmental accounts – Emissions to air 2023
Greenhouse gas emissions from Sweden's economy decrease by 1,5 percent in 2023
Statistical news from Statistics Sweden 2025-03-27 8.00
Greenhouse gas emissions from Sweden's economy amounted to 49 million tons of carbon dioxide equivalents in 2023, which corresponds to a decrease of 1,5 percent compared to 2022. The emission reductions are mainly seen in the energy sector, the steel and metal industry, and in private consumption, where car driving accounts for the majority of emissions. During the same period, GDP decreased by 0,1 percent, resulting in a reduction in greenhouse gas intensity in the economy by 1,4 percent in 2023.
Greenhouse gas emissions from the Swedish economy amounted to 49 million tons of carbon dioxide equivalents in 2023. This is a decrease of 1,5 percent compared to 2022, which corresponds to 1,1 million tons of carbon dioxide equivalents.
Between 2008 and 2023, greenhouse gas emissions from Sweden's economy have decreased by 28 percent in total. During the same period, GDP has grown by 29 percent, resulting in a decrease in greenhouse gas intensity in the economy by 44 percent since the beginning of the time series. Greenhouse gas emissions followed the economic development between 2008 and 2010, but subsequent years generally show decreasing emissions while the economy grows, leading to a reduction in greenhouse gas intensity.
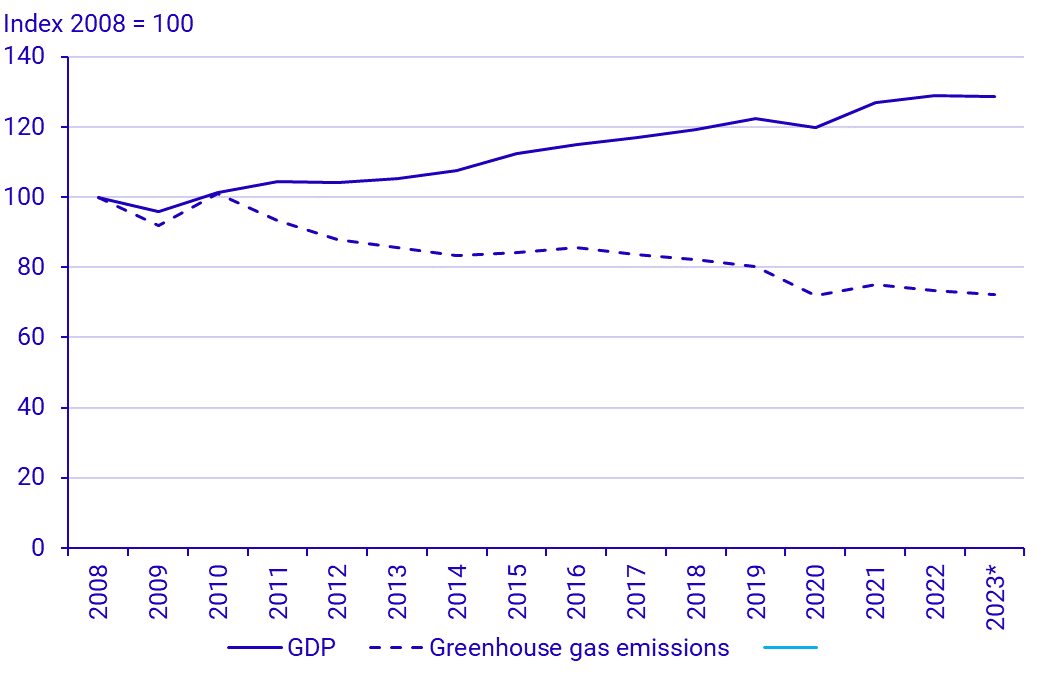
*GDP in constant prices (2023) is preliminary regarding 2023 Source: SCB, Environmental Accounts and National Accounts
Emissions decrease in most sectors
Greenhouse gas emissions in 2023 decreased mainly within the energy sector (-6 percent), construction (-5 percent), and the steel and metal industry (-3 percent). Private consumption, where car driving accounts for the majority of emissions, also experienced decreased emissions of 2 percent in 2023 compared to 2022.
The most significant emission increases in 2023 came from the paper industry, which increased its emissions by 17 percent, and the transport industry which increased its emissions by 4 percent due to increased emissions of 14 percent from aviation. The increase in emissions from aviation, which is the largest in absolute terms, led to the emission level for the aviation industry being higher in 2023 than before the pandemic. The COVID-19 pandemic significantly affected the aviation industry's emissions, with an observed decrease of over 60 % during the first year of the pandemic in 2020 compared to the previous year.
For most other branches, emissions decreased in 2023 compared to 2022, contributing to the overall reduction of greenhouse gas emissions in the Swedish economy.
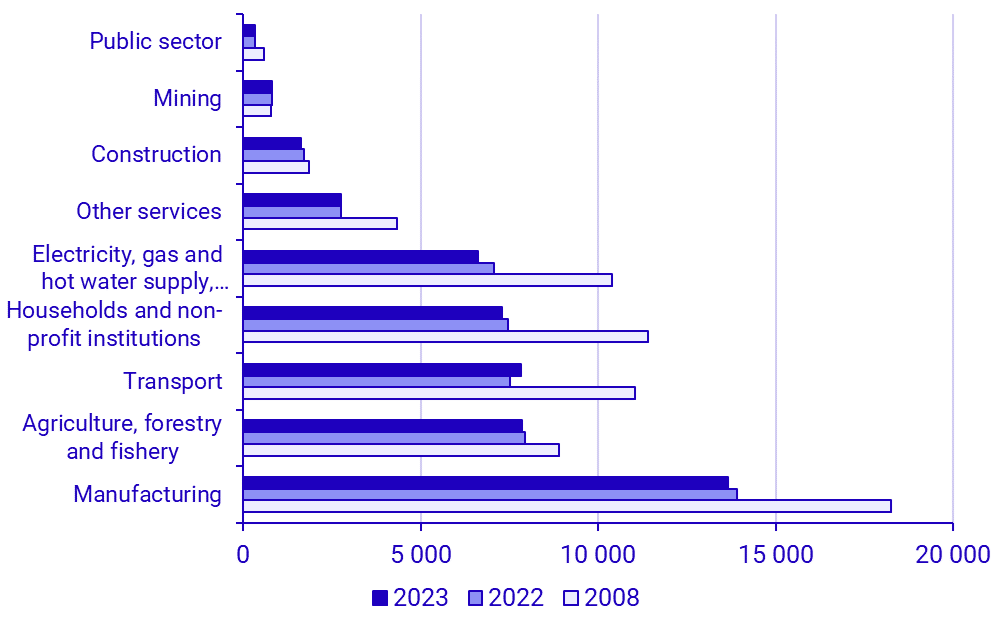
Source: SCB Environmental Accounts
Biogenic emissions decreased in 2023
Emissions from the use of biogenic fuels such as wood, biogas, and biogenic waste give rise to biogenic carbon dioxide emissions. The statistics on these emissions are published as part of the air accounts. According to international regulations and Sweden's climate goals, these emissions are not included in greenhouse gas emissions but are reported as a separate time series.
In 2023, carbon dioxide emissions from biogenic fuels amounted to 53 million tons, which corresponds to a decrease of 1,5 percent compared to the previous year. Biogenic carbon dioxide emissions mainly occur in the energy sector and the manufacturing industry, where a lot of stationary combustion takes place. Since 2008, which is the first year in a comparable time series, total biogenic carbon dioxide emissions have increased by 25 percent. In 2023, the energy sector and paper industries contributed most to the total reduction of biogenic emissions, while the steel and metal industry, food industry, and aviation industry at the same time accounted for the largest emission increases.
The energy and manufacturing industries generally account for the majority of Sweden's biogenic carbon dioxide emissions. In sectors where emissions are mainly transport related, such as mineral extraction, construction, and the transport industry, biogenic emissions are relatively small.
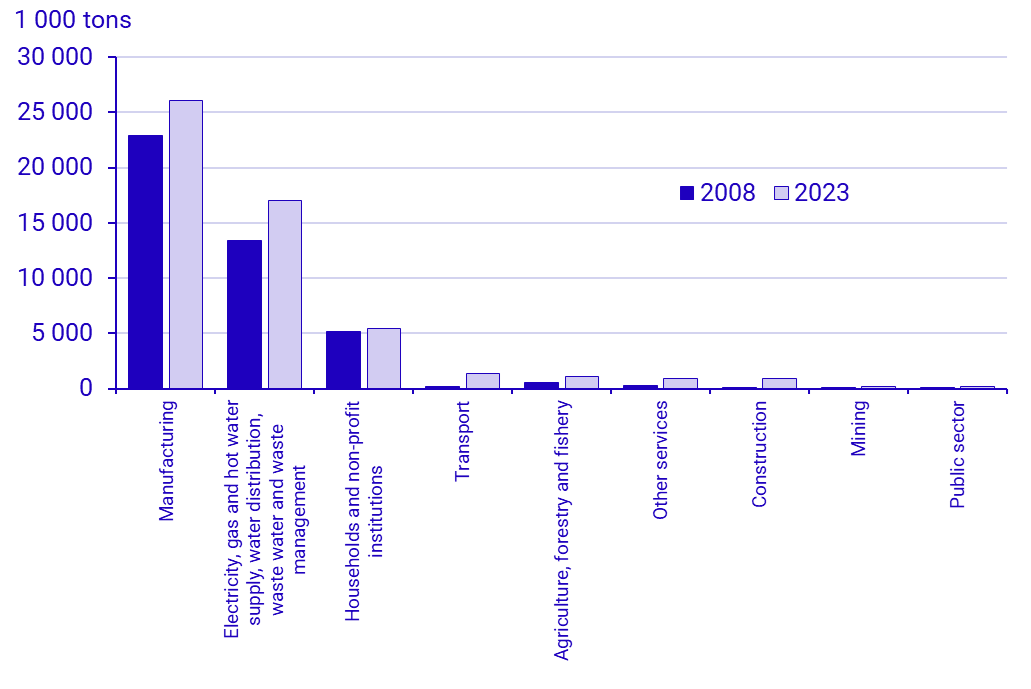
SCB Environmental Accounts
Analytical tool for Environmental Accounts data
The statistics from the Environmental Accounts are available via our analytical tool on the web. There you will find data from the Environmental Accounts, economic data, and emission statistics from both a production and consumption perspective. These data can be further analyzed together with data on policy instruments. Additionally, the tool allows you to create your own key figures, compare environmental impacts between industries, and study the relationship between economic demand, energy use, and emissions of various substances. The tool is available on the Environmental Accounts website (www.scb.se/mi1301) and is updated once every year.
Definitions and explanations
Environmental Accounts are based on the National Accounts and present national environmental statistics and economic statistics in a common system. This provides opportunities to analyze the relationships between the economy and the environment. The starting point is the environmental impact of Swedish economic actors, regardless of where in the world the environmental impact occurs.
The published statistics on emissions to air are based on a production perspective. This means that emissions are reported with regards to the economic actor behind the emissions, including households' direct emissions (i.e., combustion of fossil fuels, heating, and other direct emissions). Indirect emissions from imports and other consumption of goods and services are not included.
The Swedish Environmental Protection Agency's statistics on emissions to air report territorial emissions, i.e., emissions that have occurred within Sweden's borders. Emissions are reported based on the type of emissions rather than by industry. Emissions and uptake from land use are included, while emissions from international transports are reported separately. See Klimatomställning (naturvardsverket.se)
The difference between the Swedish Environmental Protection Agency's territorial perspective and the Environmental Accounts' production perspective is that the latter excludes emissions generated by foreign companies within Sweden's borders, but includes emissions caused by Swedish companies abroad.
Adjusting compiled data with a territorial perspective to the Environmental Accounts' production perspective on economic residence is called a residence adjustment.
Greenhouse gases in terms of carbon dioxide equivalents are calculated as an aggregate of CO2 (fossil), CH4, N2O, HFC, PFC, and SF6. The conversion factors (Greenhouse Warming Potential, GWP) used to calculate carbon dioxide equivalents are the same factors used in the reporting to the UNFCCC[1].
Revisions
Since the previous publication, a number of revisions have been made.
- Revisions due to input data occur continuously and have also taken place this year.
- Several new emission factors due to revisions in IPCC reporting, especially for particles.
- New calculation of waste emissions introduced for the entire time period. The distribution between fossil and bio has been done since 2022.
More information about these updates can be found on the Environmental Accounts website www.scb.se/mi1301 under the heading Documentation.
[1] IPCC, 2014: Climate Change 2014: Synthesis Report. Contribution of Working Groups I, II and III to the Fifth Assessment Report of the
Intergovernmental Panel on Climate Change [Core Writing Team, R.K. Pachauri and L.A. Meyer (eds.)]. IPCC, Geneva, Switzerland, 151 pp, AR5 Synthesis Report - Climate Change 2014 (ipcc.ch)
Next publishing will be
The next publication regarding quarterly emissions to air, up to and including the fourth quarter of 2024, will take place in May 2025. Preliminary statistics for the year 2024 will also be published at that time.
The next publication regarding emissions to air up to and including 2024 will take place in the spring of 2026.
Statistical Database
More information is available in the Statistical Database
Feel free to use the facts from this statistical news but remember to state Source: Statistics Sweden.