Environmental Accounts – Emissions to air fourth quarter 2023
Greenhouse gas emissions from the Swedish economy decrease in 2023
Statistical news from Statistics Sweden 2024-05-29 8.00
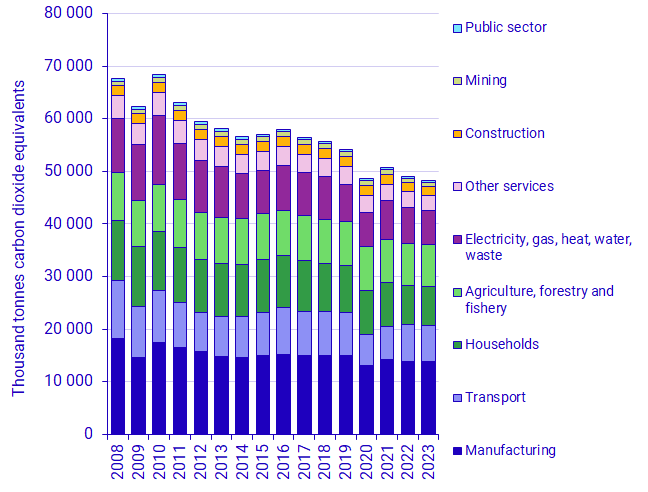
Emissions of greenhouse gases from the Swedish economy during 2023 decrease by almost 2 percent compared to the previous year. The emission reduction is primarily seen in electricity, gas and heating plants and water, sewage and waste industries, but emission reductions from the transport industry and from the steel and metal industry also contribute significantly to the total reduction in greenhouse gas emissions.
Preliminary calculations of greenhouse gas emissions from the Swedish economy in 2023 show a reduction in emissions from the Swedish economy by 0.8 million tons compared to 2022. Except for an increase in emissions in the manufacturing of coal products, refined petroleum, chemical and chemical products as well as basic pharmaceutical products and medicines (SNI C19-C21), emission reductions occur in most industries.
– The emission reduction in 2023 can primarily be attributed to the electricity and district heating sector, but also to the transport industries and the steel and metal industry, says Fredrik Kanlén, analyst at Statistics Sweden's environmental accounts.
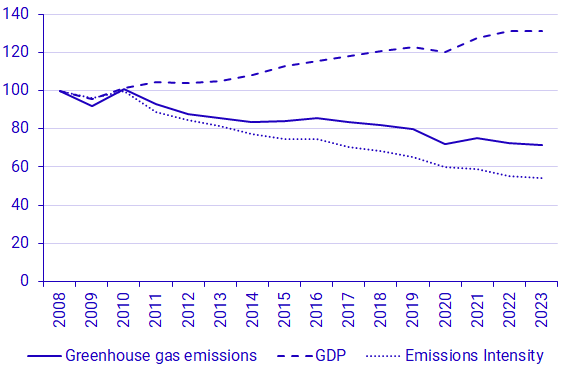
Greenhouse gas emissions from the Swedish economy decrease by 1.6 percent in 2023 compared to the previous year, and amount to 48.3 million tons of carbon dioxide equivalents. This is according to the preliminary emissions statistics for 2023 (summed quarters). During the same period, GDP decreases by 0.2 percent, which means that the emission intensity, measured as the emissions of greenhouse gases calculated per economic output, also continues to decrease.
After a major emission reduction in 2020, heavily influenced by the corona pandemic, emissions increased again by several percent in 2021. Thereafter, emissions have decreased, both in 2022 and in 2023 according to the preliminary emissions calculations. Compared to the emission level before the pandemic in 2019, greenhouse gas emissions are 11 percent lower in 2023.
Emission trends during 2023 in brief
The reduction in emissions is mainly seen in electricity, gas and heating plants and water, sewage and waste industries (SNI D35-E39), but also in the transport industries and in the steel and metal industry. The percentages below are in comparison with the previous year, unless otherwise stated, and greenhouse gas emissions are measured in kilotons of carbon dioxide equivalents.
- In electricity, gas and heating plants and water, sewage and waste industries (SNI D35-E39), emissions decrease by 6 percent, which corresponds to approximately 420 kilotons.
- In the transport industries (SNI H49 – H53) emissions decrease by approximately 220 kilotons, which corresponds to a 3 percent reduction. Aviation (SNI H51) account for the largest reduction while emissions from shipping companies are unchanged (SNI H50). Emissions from road transport (SNI H49) show a decrease.
- Emissions from private consumption decrease by 1 percent. This corresponds to a reduction of almost 70 kilotons and is mainly due to reduced greenhouse gas emissions from diesel use in private transport.
- Emissions from steel and metal production (SNI C24-C25) decrease by 6 percent, which corresponds to approximately 300 kilotons.
- The industries for manufacturing coal products, refined petroleum, chemical and chemical products as well as pharmaceutical base products and medicines (SNI C19-C21) increase their emissions by approximately 540 kilotons. This corresponds to a 14 percent increase.
At the same time, the value added in the entire manufacturing industry decreases by 6 percent.
| SNI 2007 aggregate | Greenhouse gas emissions | Value added | ||||
|---|---|---|---|---|---|---|
| 2023 [1] | Change compared to 2022 |
2023 [1] | Change compared to 2022 |
|||
| Agriculture, forestry and fishery |
8 029 | ‑34 | ‑0.4% | 86 916 | ‑580 | ‑0.7% |
| Mining | 823 | 2 | ‑0.2% | 44 668 | ‑4 461 | ‑9.1% |
| Manufacturing | 13 881 | 54 | 0.2% | 7 53 307 | ‑47 502 | ‑5.9% |
| Electricity, gas, heat, water, waste |
6 408 | ‑421 | ‑6.2% | 2 27 589 | ‑2 499 | ‑1.1% |
| Construction | 1 762 | ‑47 | ‑2.6% | 3 66 513 | 16 326 | 4.7% |
| Transport | 6 781 | ‑218 | ‑3.1% | 1 79 703 | ‑1 707 | ‑0.9% |
| Other services | 2 857 | ‑56 | ‑1.9% | 25 66 093 | 31 390 | 1.2% |
| Public sector | 363 | ‑4 | ‑1.0% | 10 25 613 | 7 208 | 0.7% |
| Households and non- profit institutions [2] |
7 394 | ‑67 | ‑0.9% | 64 860 | 852 | 1.3% |
| Total economy [3] | 48 299 | ‑791 | ‑1.6% | 5 959 836 | ‑11 715 | ‑0.2% |
1] Greenhouse gas emissions and value added are preliminary and calculated based on summed quarters [2] Only non-profit institutions provide value added. [3] GDP from a production approach (not calendar corrected). Source: Statistics Sweden
Emission trends during the fourth quarter of 2023 in brief
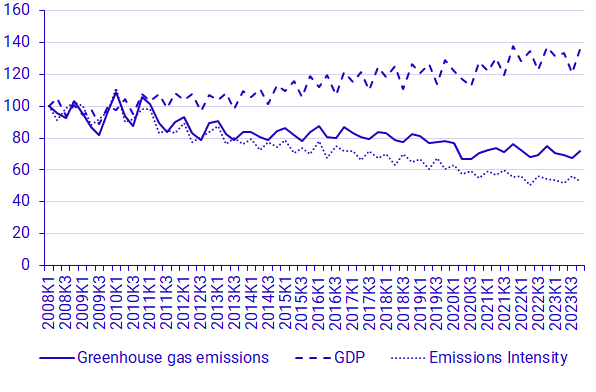
Greenhouse gas emissions from the Swedish economy amount to 12.4 million tons of carbon dioxide equivalents in the fourth quarter of 2023. This is a 4 percent emission reduction compared to the corresponding quarter the previous year. During the same period, GDP decreases by almost 1 percent.
The emission reductions are mainly seen in the transport industries and in electricity, gas and heating plants and water, sewage and waste (SNI D35-E39). At the same time, small increases in emissions are seen from the steel and metal industry and from the mining industries.
Definitions and explanations
What do the quarterly statistics show?
The quarterly statistics from Statistics Sweden's environmental accounts report production-based emissions to air per industry from the Swedish economy, which also includes households. Production-based emissions include emissions of greenhouse gases from Swedish economic actors and differ in that respect from territorial emissions, which relates to national borders and constitute the statistics that are used to follow emission trends in relation to climate goals within the UN, EU and nationally.
Read more about different ways to calculate greenhouse gas emissions: Tre sätt att beräkna klimatpåverkande utsläpp (naturvardsverket.se)
The quarterly statistics cover emissions from Swedish companies and persons, both within as well as outside Sweden's borders. Emissions with the production perspective follow the same system boundary as the national economic statistics, i.e. the national accounts.
For the transport industry, emissions arising from transport companies with economic residence in Sweden are included regardless of where in the world these emissions occur. Emissions from e.g. foreign airlines flying to, from or within Sweden are not included.
When comparing quarters, the reader should be attentive to seasonal variation. For example, emissions from sectors covering electricity, gas, heat, water and waste are higher during the winter, whereas households’ consumption of diesel and petrol are higher during the summer.
Greenhouse gases in terms of carbon dioxide equivalents are calculated as an aggregate of fossil CO2, CH4, N2O, HFCs, PFCs and SF6. The conversion factors (Global Warming Potential, GWP) used to calculate carbon dioxide equivalents are also the factors used for reporting to the UNFCCC[1].
Biogenic CO2 is reported separately and is not included in reported aggregates for greenhouse gases and carbon dioxide equivalents. More information about biogenic CO2 and its climate impact is available on the Swedish Environmental Protection Agency's website: Biogena koldioxidutsläpp och klimatpåverkan (naturvardsverket.se)
[1] IPCC, 2014: Climate Change 2014: Synthesis Report. Contribution of Working Groups I, II and III to the Fifth Assessment Report of the Intergovernmental Panel on Climate Change [Core Writing Team, R.K. Pachauri and L.A. Meyer (eds.)]. IPCC, Geneva, Switzerland, 151 pp, AR5 Synthesis Report - Climate Change 2014 (ipcc.ch)
Revisions
- For the aviation industry, OECD data is now used for all quarters and years up to 2023, where aviation emissions are calibrated with the volumes of delivered fuel.
- Various revisions have been made within the IPCC reporting that affect emission data for working machinery, road transport and emission factors regarding stationary combustion. This is concerning both waste as well as fossil gases.
More information about emission accounts is available on the Statistics Sweden’s website Miljöräkenskaper (scb.se) under the heading Dokumentation.
Next publishing will be
The next statistical news on quarterly emissions to air for the first quarter of 2024, is scheduled for August 29th 2024.
Statistical Database
More information is available in the Statistical Database
Feel free to use the facts from this statistical news but remember to state Source: Statistics Sweden.