Environmental Accounts – Emissions to air second quarter 2024
Greenhouse gas emissions from the Swedish economy increase during the second quarter of 2024
Statistical news from Statistics Sweden 2024-10-24 8.00
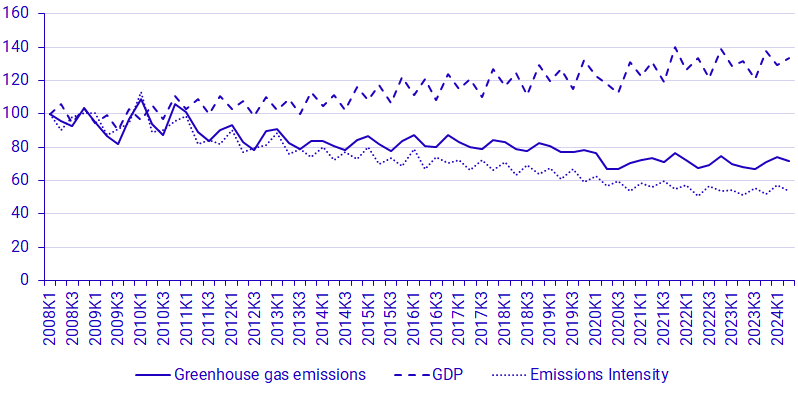
Greenhouse gas emissions from the Swedish economy increase by 5.6 percent in the second quarter of 2024 compared to the same quarter in 2023. The largest increase between these quarters is for emissions from households, the construction industry and the transport sector. The emission intensity for the Swedish economy increases by 4.5 percent during the second quarter of 2024 compared to the same quarter in 2023.
- The second quarter of 2024 has the largest emissions for any second quarter since 2021. Emissions have increased by 5.6 percent compared to the second quarter of 2023, says Johanna Takman, analyst at Statistics Sweden's Environmental Accounts.
The quarterly statistics from Statistics Sweden’s Environmental Accounts report production-based air emissions per industry from Sweden's economy, which also include households.
The second quarter of 2024 shows total greenhouse gas emissions of 12.4 million tonnes of carbon dioxide equivalents from the Swedish economy. During the same quarter of 2023, total greenhouse gas emissions were 11.8 million tonnes of carbon dioxide equivalents.
The emission intensity - the greenhouse gas emissions per Swedish krona (SEK) produced in the economy - increases by 4.5 percent during the second quarter of 2024[1]. Sweden´s GDP increased by 1 percent between the second quarter of 2023 and the second quarter of 2024.
The Swedish carbon reduction policy (for the share of biofuel in transport fuels) was revised in January 2024 where the share for diesel was reduced from 30.5 percent to 6 percent, and for petrol was reduced from 7.8 percent to 6 percent.
Changes during the second quarter of 2024 in brief
The percentage changes below are based on a comparison with the corresponding quarter in the previous year, unless otherwise stated. Emissions refer to greenhouse gas emissions measured in kilotons of carbon dioxide equivalents.
- Emissions from the Swedish economy increased by 5,6 percent in the second quarter of 2024 and amounted to 12.4 million tons of carbon dioxide equivalents.
- Emissions from the construction industry increased by 28 percent which amount to 126 kilotons of carbon dioxide equivalents, mainly due to increased use of fossil diesel.
- Emissions from private consumption increased by 9 percent, which is an increase of 161 kilotons. This is mainly due to increased emissions from fossil diesel use.
- Emissions from the transport sector (NACE H49-H53) increased by 163 kilotons, which is an increase of 10 percent.
- The increased emissions from the construction industry, households and transport sector can be linked to increased delivery of fossil diesel according to the monthly fuel, gas and inventory statistics[2].
- In electricity, gas and heating production as well as water, sewage and waste treatment and management (NACE D35-E39) the emissions increased by 1.5 percent, which corresponds to 22 kilotons.
- The mining and quarrying sector (NACE B05-B09) increased its emissions by 19 percent, which represent an increase of 35 kilotons.
- Emissions decreased for the following sectors: basic metals and fabricated metal products (NACE C25-C25), rubber plastic and non-metallic minerals (NACE C22-C23), manufacture of electrical equipment (NACE C27)
[1] According to the publication of the Swedish GDP production approach from 2024-08-29
| SNI 2007 aggregate | Greenhouse gas emissions | Value added (preliminary values) | ||||
|---|---|---|---|---|---|---|
| 2024 Q2 [1] | Change compared to 2023 Q2 |
2024 Q2 [1] | Change compared to 2023 Q2 |
|||
| Agriculture, forestry and fishery | 2 076 | 90 | 4.5% | 16 203 | 582 | 3.7% |
| Mining | 220 | 35 | 18.7% | 7 492 | ‑405 | ‑5.1% |
| Manufacturing | 3 279 | ‑72 | ‑2.1% | 233 782 | 1 568 | 0.7% |
| Electricity, gas, heat, water, waste | 1 474 | 22 | 1.5% | 34 609 | 2 066 | 6.3% |
| Construction | 572 | 126 | 28.4% | 93 868 | ‑2 898 | ‑3.0% |
| Transport | 1 793 | 163 | 10.0% | 40 683 | ‑6 871 | ‑14.4% |
| Other services | 840 | 117 | 16.2% | 687 861 | 14 843 | 2.2% |
| Public sector | 97 | 10 | 11.4% | 293 042 | 9 512 | 3.4% |
| Households and non-profit institutions [2] | 2 062 | 162 | 8.5% | 18 133 | 509 | 2.9% |
| Total economy [3] | 12 411 | 654 | 5.6% | 1 595 390 | 16 439 | 1.0% |
[1] Greenhouse gas emissions and value added are preliminary.[2] Only non-profit institutions provide value added.[3] GDP from a production approach (not calendar corrected), published 2024-08-29.Source: Statistics Sweden
Definitions and explanations
What do the quarterly statistics show?
The quarterly statistics from Statistics Sweden's environmental accounts report production-based emissions to air per industry from the Swedish economy, which also includes households. Production-based emissions are emissions of greenhouse gases by Swedish economic actors and differ from the territorial emissions, which instead include emissions within the national borders. The territorial emissions are used in the UN, EU and nationally to follow up climate targets. The production-based emission statistics include the emissions from Swedish companies and individuals that occur both outside and inside Sweden's borders. Production-based emissions use the same system boundary as the national economic statistics, i.e., the national accounts.
For the transport industry, emissions arising from transport companies with economic residence in Sweden are included, regardless of where in the world these emissions occur. Emissions from, e.g., foreign airlines flying to, from or within Sweden are not included.
When comparing quarters, the reader should be attentive to seasonal variation. For example, emissions from electricity, gas, heat, water, waste are higher during the winter whereas households’ consumption of diesel and petrol are higher during the summer.
Greenhouse gas emissions – carbon dioxide equivalents are calculated as an aggregate of CO2 (fossil), CH4, N2O, HFC, PFC, SF6. The conversion factors (Greenhouse Warming Potential, GWP) used to calculate carbon dioxide equivalents are the same as those used for reporting to UNFCCC.
[1] IPCC, 2014: Climate Change 2014: Synthesis Report. Contribution of Working Groups I, II and III to the Fifth Assessment Report of the Intergovernmental Panel on Climate Change [Core Writing Team, R.K. Pachauri and L.A. Meyer (eds.)]. IPCC, Geneva, Switzerland, 151 pp, AR5 Synthesis Report - Climate Change 2014 (ipcc.ch)
More information about emission accounts is available on the Statistics Sweden’s website Miljöräkenskaper (scb.se) under the heading (in Swedish): Dokumentation
Next publishing will be
The next statistical news on quarterly emissions to air for the third quarter of 2024, is scheduled for January 2024.
Statistical Database
More information is available in the Statistical Database
Feel free to use the facts from this statistical news but remember to state Source: Statistics Sweden.