Environmental Accounts – Emissions to air third quarter 2024
Greenhouse gas emissions from the Swedish economy increased during the third quarter of 2024
Statistical news from Statistics Sweden 2025-01-30 8.00
Greenhouse gas emissions from the Swedish economy increased by 6.4 percent in the third quarter of 2024 compared to the same quarter in 2023. The largest increases in emissions are from household consumption, the construction industry and the transport sector. The trends in emissions follow the same pattern as the two previous quarters of 2024.
- The third quarter of 2024 has the largest emissions for any third quarter since 2021. Emissions have increased by 6.4 percent compared to the third quarter of 2023, says Nils Brown, analyst at Statistics Sweden's Environmental Accounts.
The quarterly statistics from Statistics Sweden’s Environmental Accounts report production-based air emissions per industry from Sweden's economy, which also include households.
The third quarter of 2024 shows total greenhouse gas emissions of 12.3 million tonnes of carbon dioxide equivalents from the Swedish economy. During the same quarter of 2023, total greenhouse gas emissions were 11.5 million tonnes of carbon dioxide equivalents.
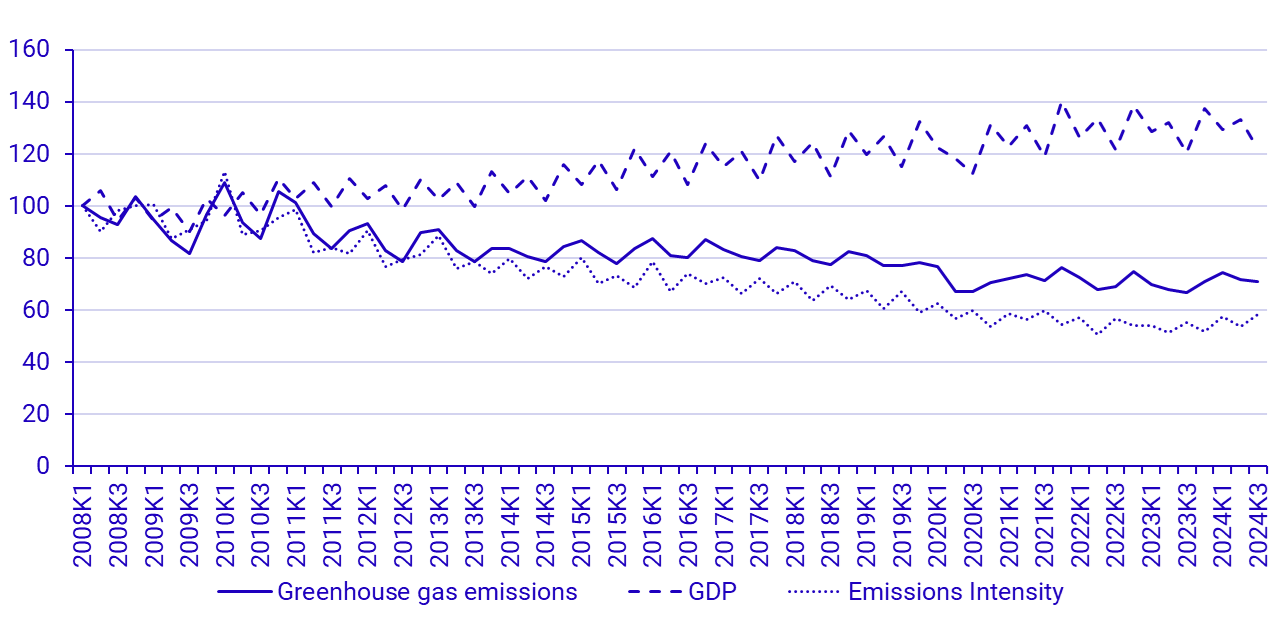
The emission intensity - the greenhouse gas emissions per Swedish krona (SEK) produced in the economy - increases by 5.2 percent during the third quarter of 2024[1]. Sweden’s GDP increased by 1 percent between the third quarter of 2023 and the third quarter of 2024.
The increase in greenhouse gas emissions can largely be attributed to increased deliveries of fossil diesel relative to total diesel usage, as shown by monthly fuel, gas and stocks statistics[2]. The Swedish carbon reduction policy (for the share of biofuel in transport fuels) was revised in January 2024 where the share for diesel was reduced from 30.5 percent to 6 percent, and for petrol was reduced from 7.8 percent to 6 percent.
Changes during the third quarter of 2024 in brief
The percentage changes below are based on a comparison with the corresponding quarter in the previous year, unless otherwise stated. Emissions refer to greenhouse gas emissions measured in kilotons of carbon dioxide equivalents.
- Emissions from the Swedish economy increased by 4 percent in the third quarter of 2024 and amounted to 12.3 million tonnes of carbon dioxide equivalents.
- Of 36 industry divisions, greenhouse gas emissions increased in 33.
- Emissions from the construction industry increased by 35 percent which amount to 155 kilotonnes of carbon dioxide equivalents, mainly due to increased use of fossil diesel.
- Emissions from household consumption increased by 14 percent, which corresponds to an increase of 263 kilotonnes.
- Emissions from the transport sector increased by 128 kilotonnes, which is an increase of seven percent.
- For emissions from industries within the manufacturing sector percentage increases in the manufacture of food, beverages and tobacco and manufacture of furniture, other manufacturing and repair and installation of machinery and equipment stand out. The increases are 42 percent corresponding to 48 kilotonnes and 40 percent corresponding to ten kilotonnes respectively.
- The largest increases can be seen in the sectors that use plenty of diesel.
- In electricity, gas and heating production as well as water, sewage and waste treatment and management the emissions decreased by 16 percent, which corresponds to 195 kilotonnes One of the reasons for the decrease are technical issues in production.
[1] According to the publication of the Swedish GDP production approach from 2024-11-29
| NACE 2007 industry | Greenhouse gas emissions | Value added | |||||
|---|---|---|---|---|---|---|---|
| 2024Q3 | Change compared to same quarter 2023 | 2024Q3 | Change compared to 2023Q3 | ||||
| Agriculture, forestry and fishery | 2 104 | 113 | 5.7% | 14 152 | ‑104 | ‑0.7% | |
| Mining | 215 | 15 | 7.7% | 8 321 | ‑2 077 | ‑20.0% | |
| Manufacturing | 3 306 | 96 | 3.0% | 195 611 | ‑2 702 | ‑1.4% | |
| Electricity, gas, heat, water, waste | 1 046 | ‑195 | ‑15.7% | 29 618 | ‑1 197 | ‑3.9% | |
| Construction | 596 | 155 | 35.1% | 85 649 | 3 308 | 4.0% | |
| Transport | 1 860 | 128 | 7.4% | 39 094 | ‑3 947 | ‑9.2% | |
| Other services | 874 | 154 | 21.4% | 664 772 | 13 398 | 2.1% | |
| Public sector | 100 | 14 | 16.1% | 248 457 | 9 128 | 3.8% | |
| Households and non-profit institutions[1] | 2 178 | 263 | 13.8% | 15 970 | ‑152 | ‑0.9% | |
| Total economy[2] | 12 279 | 743 | 6.4% | 1 459 649 | 17 388 | 1.2% | |
[1] Only non-profit institutions provide value added. [2] GDP from a production approach (not calendar corrected), published 2024-11-29.
Definitions and explanations
What do the quarterly statistics show?
The quarterly statistics from Statistics Sweden's environmental accounts report production-based emissions to air per industry from the Swedish economy, which also includes households. Production-based emissions are emissions of greenhouse gases by Swedish economic actors and differ from the territorial emissions, which instead include emissions within the national borders. The territorial emissions are used in the UN, EU and nationally to follow up climate targets. The production-based emission statistics include the emissions from Swedish companies and individuals that occur both outside and inside Sweden's borders. Production-based emissions use the same system boundary as the national economic statistics, i.e., the national accounts.
For the transport industry, emissions arising from transport companies with economic residence in Sweden are included, regardless of where in the world these emissions occur. Emissions from, e.g., foreign airlines flying to, from or within Sweden are not included.
When comparing quarters, the reader should be attentive to seasonal variation. For example, emissions from electricity, gas, heat, water, waste are higher during the winter whereas households’ consumption of diesel and petrol are higher during the summer.
Greenhouse gas emissions – carbon dioxide equivalents are calculated as an aggregate of CO2 (fossil), CH4, N2O, HFC, PFC, SF6. The conversion factors (Greenhouse Warming Potential, GWP) used to calculate carbon dioxide equivalents are the same as those used for reporting to UNFCCC.
[1] IPCC, 2014: Climate Change 2014: Synthesis Report. Contribution of Working Groups I, II and III to the Fifth Assessment Report of the Intergovernmental Panel on Climate Change [Core Writing Team, R.K. Pachauri and L.A. Meyer (eds.)]. IPCC, Geneva, Switzerland, 151 pp, AR5 Synthesis Report - Climate Change 2014 (ipcc.ch)
More information about emission accounts is available on the Statistics Sweden’s website Miljöräkenskaper (scb.se) under the heading (in Swedish): Dokumentation
Revisions
The entire time series is produced with updated input data. This means that the emissions reported in this publication may differ from the emission presented in previous publications.
Next publishing will be
The next statistical news on quarterly emissions to air for the fourth quarter of 2024, is scheduled for May 2025.
Statistical Database
More information is available in the Statistical Database
Feel free to use the facts from this statistical news but remember to state Source: Statistics Sweden.