Environmental accounts – Emissions to air 2020
Greenhouse gas emissions from the Swedish economy decreased by 11 percent in 2020
Statistical news from Statistics Sweden 2022-04-20 8.00
Greenhouse gas emissions from the Swedish economy decreased by 11 percent in 2020 compared with 2019. Over the same period, GDP decreased by 3.3 percent. Therefore Sweden’s greenhouse gas intensity (emissions per unit of monetary production in the economy) decreased by 8 percent over the period.
This page was corrected 2022-08-08
In 2020 greenhouse gas emissions from the Swedish economy were 47.6 million tonnes of carbon dioxide equivalents. This is a decrease of 5.7 million tonnes of carbon dioxide equivalents compared with 2019. The decrease in greenhouse gas emissions between 2019 and 2020 is the largest percentagewise decrease between two years since the start of the time series in 2008. Between 2008 and 2020, greenhouse gas emissions have decreased by 30 percent. Over the same period, Sweden’s GDP has increased by 19 percent. Emissions followed economic trends between 2008 and 2010. Between 2010 and 2014, emissions decreased by 17 percent at the same time that GDP increased by 7 percent. Between 2014 and 2019 emissions decreased by 6 percent while GDP increased by 14 percent.
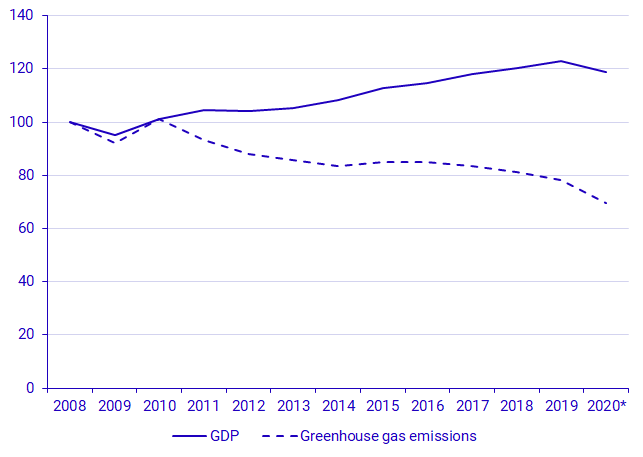
*2020 GDP in fixed prices are preliminary. Source: Statistics Sweden, Environmental accounts and National accounts
Emissions from the energy, transport and manufacturing industries decreased
Greenhouse gas emissions decreased from nearly all sectors in 2020 compared with 2019. In the transport industry, emissions were 29 percent lower in 2020 compared with 2019. The transport industry’s emissions includes those from aviation, maritime transport and road haulage. Emissions from aviation decreased the most in 2020 compared to 2019, by 61 percent*. This decrease is connected to decreased air travel due to the Covid-19 pandemic.
Greenhouse gas emissions from the manufacturing industry decreased by 14 percent and emissions from energy and utilities decreased by 8 percent in the same period. For agriculture, forestry and fisheries and the mining industry, emissions were relatively unchanged in 2020 compared with 2019.
* The value was previously incorrectly stated as 39 percent.
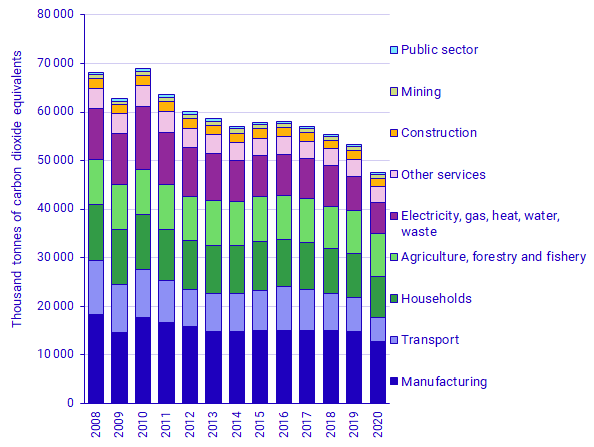
Source: Statistics Sweden, Environmental accounts.
Proportion of biofuel combustion increased
The proportion of biofuels, that is, biofuel use in relation to total fuel use (fossil and biogenic) in the Swedish economy has increased from 39 percent in 2008 to 55 percent in 2020. This is due to an increase in the amount of biofuels and a decrease in the amount of fossil fuels over the period. Between 2019 and 2020 the proportion of biofuels increased by 2 percent.
The proportion of biofuels is largest in the electricity, gas and district heating and manufacturing industries. These industries also account for the largest use of biofuels overall. The proportion of biofuels in these industries also increased between 2019 and 2020 by 0.9 and 1.5 percent respectively.
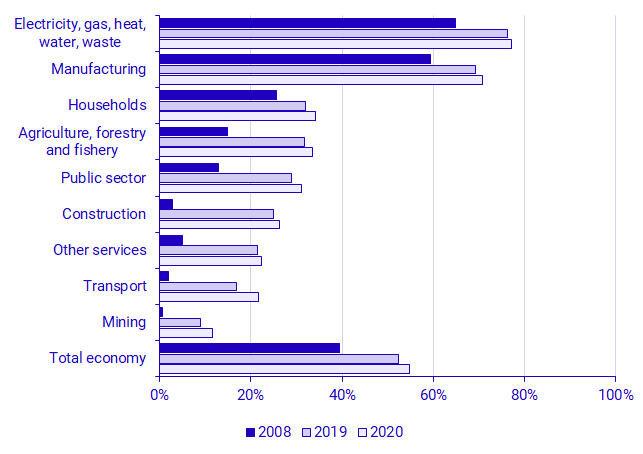
Source: Statistics Sweden, Environmental accounts
Environmental economic profiles updates later in the year
The Environmental Accounts also presents industries’ emissions in relation to employment and value added (industry’s contribution to GDP). However, the air emissions statistics are prepared and published before the annual employment and value added statistics. Therefore, emissions intensities and environmental-economic profiles will be updated later in the year, when this data becomes available for 2020.
Use the analytical tool for environmental economic data
Environmental accounts data is available via an analytical tool online that combines data from the Environmental Accounts and economic data. This tool can be used to explore emissions statistics from both production and consumption perspectives along with other environmental economic data. The tool is available on the Environmental Accounts’ data and analysis pages:
System of Environmental and Economic Accounts
Using the tool, you can generate your own indicators, compare environmental pressures from different industries and study the relationship between demand in the economy, energy use, and emissions.
Definitions and explanations
The Environmental Accounts present national environmental statistics and economic statistics in a common framework using NACE industry classification. This makes it possible to analyse the relationship between the economy and the environment. The starting point for the Environmental Accounts is the environmental impact of Swedish economic actors, regardless of where in the world their emissions occur.
These statistics on emissions to air are based on a production perspective. Emissions are reported by industry in which the emissions occur, including households’ direct emissions (i.e. combustion of fossil fuels, heating and other direct emissions). Indirect emissions from imports and other consumption of goods and services are not included.
Statistics on emissions to air published by the Swedish Environmental Protection Agency follow the UNFCCC framework and cover emissions within Sweden’s territorial borders. Sectors are disaggregated by emissions category (process), rather than by industry. Emissions and removals from land use and land use change are included, while emissions from international aviation and navigation are reported separately. See also:
Klimatutsläpp (in Swedish)
The adjustment of data sources that are produced using a territorial perspective to the environmental accounts’ production perspective of economic residence is called a residence adjustment.
Revisions
A number of revisions have been applied since the previous publication.
-In this publication, residence adjustment (see also above in definitions and explanations) for H51 air transport has been based on OECD’s time series on carbon dioxide emissions from aviation:
This data source was first published in the summer of 2021 and is based in turn on information from the Automatic Dependant Surveillance -Broadcast (ADS-B) and a database of scheduled flight information. These data sources also give information about the economic residence of the flight operator for each flight. Therefore the data source is valuable for producing data on emissions from the Swedish air transport industry according to a residency principle. More information is available by following the web link above.
This revision has led to a decrease in greenhouse gas emissions from H51 air transport industry by between 30 and 50 percent (depending on the reference year) in the time series published in March 2022 compared with that published in March 2021. This change also leads to a decrease in total greenhouse gas emissions from the Swedish economy by up to 3 percent (depending on the reference year).
The mining industry’s greenhouse gas emissions (B05-B09 mining and quarrying) has been revised downward for all reference years from (and including) 2016 and forward by between 25 and 30 percent compared with the previous publication. This is due to a change in the allocation principles for energy demand in source data that has been applied from 2016 and forward.
Emissions from H50 water transport have been calculated based on the time series for data on vessels entering Swedish ports from Transport Analysis:
More information on these updates are available under the heading Dokumentation on:
Miljöräkenskaper (in Swedish)
Next publishing will be
The next item of statistical news on quarterly emissions to air will concern the fourth quarter of 2021 will be published on 2022-05-12 at 08.00. Preliminary statistics on 2021 will also be published at this time.
The next statistical news on annual emissions to air, 20082021 (final statistics) is scheduled for publication in early 2023.
Statistical Database
More information is available in the Statistical Database
Feel free to use the facts from this statistical news but remember to state Source: Statistics Sweden.