Environmental Accounts – Emissions to air first quarter 2023
Small changes in greenhouse gas emissions from the Swedish economy during the first quarter of 2023
Statistical news from Statistics Sweden 2023-09-14 8.00
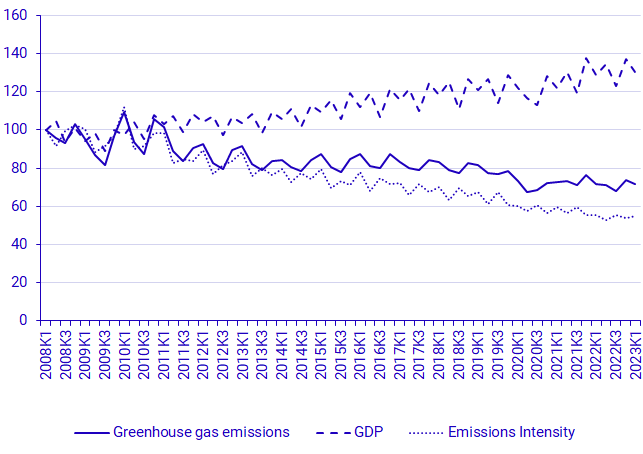
Greenhouse gas emissions from the Swedish economy increase by 0.2 percent simultaneously as the emission intensity decreases by 1.1 percent. The largest increase is within the transport sector, where the emissions increase by 5 percent during the first quarter of 2023 compared to the same quarter in 2022.
- The preliminary figures for the first quarter of 2023 show small changes in emissions compared to the previous year, at the same time the economy grew by 1.3 percent, says Dimitra Kopidou, analyst at Statistics Sweden's Environmental Accounts.
The quarterly statistics from Statistics Sweden’s Environmental Accounts report production-based air emissions per industry from Sweden's economy, which also include households.
The first quarter of 2023 shows total greenhouse gas emissions of 12.45 million tonnes of carbon dioxide equivalents from the Swedish economy. During the same quarter of 2022, total greenhouse gas emissions were almost the same at 12.43 million tonnes of carbon dioxide equivalents. Sweden's GDP increases by 1.3 percent during the same period
Therefore, the emission intensity, which means greenhouse gas emissions per Swedish krona (SEK) produced in the economy, decreases by 1.1 percent during the first quarter of 2023.
Changes during the first quarter of 2023 in brief
The percentage changes below are compared with the corresponding quarter in the previous year, unless otherwise stated. Emissions refer to greenhouse gas emissions measured in kilotons of carbon dioxide equivalents.
- Emissions from the Swedish economy increased by 0.2 percent in the first quarter of 2023 and amounted to 12.4 million tons of carbon dioxide equivalents, simultaneously as GDP increased by 1.3 percent.
- Emissions from the transport sector (NACE H49-H53) increased by 88 kilotons, of which 77 kilotons derive from the air transport industry (NACE H51).
- Emissions from private consumption increased by almost 2 percent, which is an increase of 30 kilotons. This is mainly due to increased greenhouse gas emissions from gasoline use in private transport.
- Emissions from the manufacturing sector (NACE C10-C33), and agriculture, forestry, and fishing industries (A01-A03), as well as other services are unchanged.
- In electricity, gas and heating production as well as water, sewage and waste treatment and management (NACE D35-E39) the emissions decreased by 5 percent, which corresponds to 97 kilotons.
- The metals and mining sector (NACE B05-B09) increased its emissions by 11 percent, which represent an increase of 25 kilotons.
| NACE 2007 industry | Greenhouse gas emissions | Value added | |||||
|---|---|---|---|---|---|---|---|
| 2023Q1 | Change compared to 2022Q1 | 2023Q1 | Change compared to 2022Q1 | ||||
| Agriculture, forestry and fishery | 2 056 | ‑4 | ‑0.2% | 23 570 | 93 | 0.4% | |
| Mining | 258 | 25 | 10.7% | 15 364 | ‑1 895 | ‑11.0% | |
| Manufacturing | 3 428 | ‑13 | ‑0.4% | 203 282 | ‑1 762 | ‑0.9% | |
| Electricity, gas, heat, water, waste | 1 877 | ‑97 | ‑4.9% | 70 331 | ‑218 | ‑0.3% | |
| Construction | 420 | ‑7 | ‑1.7% | 85 504 | 1 849 | 2.2% | |
| Transport | 1 752 | 88 | 5.3% | 43 519 | 690 | 1.6% | |
| Other services | 669 | 0 | 0.0% | 601 300 | 11 904 | 2.0% | |
| Public sector | 98 | 0 | 0.4% | 278 495 | 7 975 | 2.9% | |
| Households and non-profit institutions[1] | 1 888 | 30 | 1.6% | 15 250 | 562 | 3.8% | |
| Total economy[2] | 12 447 | 22 | 0.2% | 1 486 142 | 18 517 | 1.3% | |
[1] Only non-profit institutions provide value added. [2] GDP from a production approach (not calendar corrected). Source: Statistics Sweden
Definitions and explanations
What do the quarterly statistics show?
The quarterly statistics from Statistics Sweden's environmental accounts report production-based emissions to air per industry from the Swedish economy, which also includes households. Production-based emissions are emissions of greenhouse gases by Swedish economic actors. The statistics include the emissions from Swedish companies and individuals that occur both outside and inside Sweden's borders. Production-based emissions use the same system boundary as the national economic statistics, i.e., the national accounts.
For the transport industry, emissions arising from transport companies with economic residence in Sweden are included, regardless of where in the world these emissions occur. Emissions from, e.g., foreign airlines flying to, from or within Sweden are not included.
When comparing quarters, the reader should be attentive to seasonal variation. For example, emissions from electricity, gas, heat, water, waste are higher during the winter whereas households’ consumption of diesel and petrol are higher during the summer.
Greenhouse gas emissions – carbon dioxide equivalents are calculated as an aggregate of CO2 (fossil), CH4, N2O, HFC, PFC, SF6. The conversion factors (Greenhouse Warming Potential, GWP) used to calculate carbon dioxide equivalents are the same as those used for reporting to UNFCCC[1].
[1] IPCC, 2014: Climate Change 2014: Synthesis Report. Contribution of Working Groups I, II and III to the Fifth Assessment Report of the Intergovernmental Panel on Climate Change [Core Writing Team, R.K. Pachauri and L.A. Meyer (eds.)]. IPCC, Geneva, Switzerland, 151 pp, AR5 Synthesis Report - Climate Change 2014 (ipcc.ch)
Revisions
For the first quarter of 2023, several revisions have been applied since the previous publication. These are:
- Data from the monthly fuel, gas, and inventory statistics have been used instead of data from the OECD for calculating the emissions from the air transport industry for the first quarter of 2023.
- Revised figures for emissions from the shipping industry, NACE H50, have been produced for 2022 based on the Traffic Analysis’ time series of Swedish ship calls in Swedish ports: Shipping goods (trafa.se)
- Revised data from the monthly fuel, gas, and inventory statistics have prompted a change in fuel usage in transportation activities for all quarters of 2022.
- Certain fuels are allocated to other fuels during the years 2008 to 2022. This may have small effects in different quarters and different industries over the entire time series.
More information on these updates is available at Miljöräkenskaper (scb.se) under the heading (in Swedish): Dokumentation.
Next publishing will be
The next statistical news on quarterly emissions to air for the second quarter of 2023, is scheduled for 26th October 2023.
Statistical Database
More information is available in the Statistical Database
Feel free to use the facts from this statistical news but remember to state Source: Statistics Sweden.