Environmental Goods and Services Sector (EGSS) 2021
Production in the environmental sector increases in 2021
Statistical news from Statistics Sweden 2023-10-26 8.00
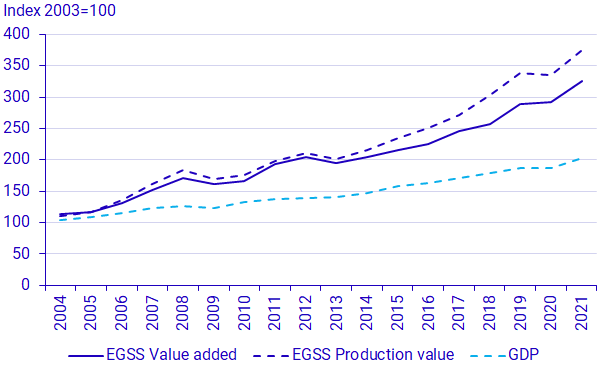
The environmental goods and services sector accounts for 4,1 percent of Sweden’s total GDP. The production of environmental goods and services increased by 12 percent from the previous year. However, 2020 was affected by the pandemic which implied an overall reduction in production level. The environmental sector employs 163 000 people, of which about 80 percent are men.
– “The economic development of the environmental sector grew faster during the period of 2020 to 2021 than the national economic development” says Fredrik Kanlén, analyst at Statistics Sweden’s Environmental Accounts.
Statistics on the environmental sector describe the part of Sweden’s economy that produces environmentally friendly goods and services. The environmental sector includes the production of goods and services for environmental protection and sustainable resource management.
The production of environmentally friendly goods and services, measured as added value, amounts to 224 billion SEK in 2021 and that is 4,1 percent of Sweden´s GDP. This can be compared to the beginning of the time series in 2003 where the environmental sector amounted to 2,6 percent. Energy saving activities represent the environmental area with the highest impact on the added value, production value and employment. The construction of passive buildings by the construction branch has an especially high impact on this area.
The production of environmentally friendly goods and services, measured as production value, increases in 2021 and amounts to 606 billion SEK. The environmental sector has increased since the beginning of the time series in 2003, with exception for a decrease occurred in 2009. The production value between 2013 and 2021 in the environmental sector increased from 326 billion SEK to 606 billion SEK, mainly due to increases in the construction and energy industries.

Source: Statistics Sweden, Environmental Accounts and National Accounts
Construction contributed the most to production
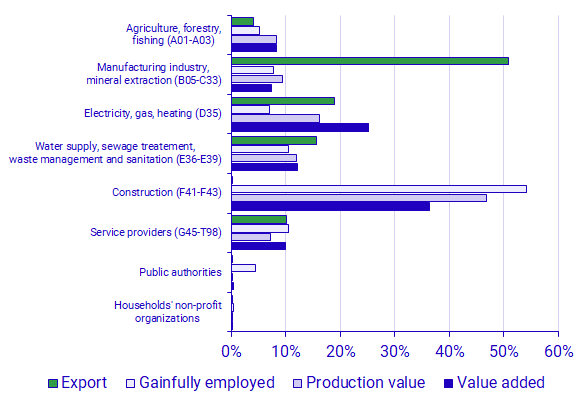
Statistics on the environmental sector are also broken down by industry (NACE rev.2). The construction industry and companies within drainage, waste and sanitation are the industries that contribute the most to production value and value added for the environmental sector in 2021. The construction industry includes all nearly-zero energy buildings according to guidelines from the European Statistical Office, Eurostat. Producers of renewable energy and companies in forestry and logging also form a large share of the environmental sector.
Regarding employment, the labour force in the environmental sector is mainly located among construction. Statistics on the environmental sector also estimate exports of goods and services from the environmental sector. Exports for the environmental sector are dominated by goods and services from the manufacturing sector.

Source: Statistics Sweden, Environmental Accounts
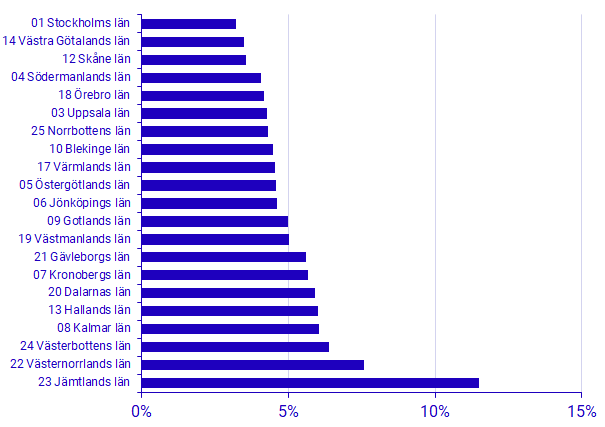
The environmental sector’s share of the economy is highest in Jämtland county
Statistics on the environmental sector are also available per county. Metropolitan regions account for the highest total value added, production value and number of persons employed. However, with regard to value added normalised as a share of gross regional product (GRP), a different picture emerges. The highest value added as share of GRP for the environmental sector is found in the counties of Jämtland, Västernorrland and Västerbotten.

Source: Statistics Sweden, Environmental and National Accounts
Revisions
Earlier statistics published in the environmental sector have been revised and the whole time series has been updated. The revisions especially concern NACE D35, energy industry, and A01, agriculture industry. In NACE D35 the companies included as well as their share of renewable energy production has been updated which led to a minor change between 2012 and 2015. In NACE A01 there has been a change from a micro- to a macro approach of the total level, which implies a reduction of production value in this branch at 20-30 percent.
A combined approach has been created for many industries this year. Earlier there was only an activity-based approach, but that has been extended to include a product-based approach. This means that companies that have a production of several environmental products are included even if they don’t belong to a specific industry. This implies that the population in the environmental sector has increased.
Definitions and explanations
Environmental accounts are organised using national accounts as a base to enable reporting on environmental statistics and economic statistics in a common system. The environmental accounts, which are a UN-based statistical standard, provide opportunities for analysing connections between the economy and the environment, in particular through the use of industries that are reported according to the Swedish Industrial Classification (SNI).
Statistics Sweden’s Environmental accounts
Statistics on the environmental sector form part of the environmental accounts framework. Since 2017, under the regulation on European environmental accounts, it is mandatory for EU Member States to report these statistics annually to Eurostat. However, Statistics Sweden has published statistics on dates earlier than this, where statistics are available as early as 2003. In connection with the publication in 2018, the statistics were revised to better align with new guidelines and to be more closely integrated with the national accounts. This also enables deeper national and international comparisons, such as the environmental sector’s contribution to the Swedish economy. In addition to the national accounts data, data on company finances is also used to describe net turnover, from RAMS (register-based labour market statistics) to describe gainful employment, and from foreign trade statistics to describe exports.
Statistics on the environmental sector are based on a micro-database of companies and workplaces that produce environmentally friendly goods and services. However, a model approach is used for the agriculture (A01), the forest (A02) and the construction (F41-43). For agriculture, the statistics are based on organic farming. For forestry and logging, statistics on the environmental sector are based on certified forestry. For construction operations, statistics on the environmental sector are based on data on nearly-zero energy buildings.
The statistics follow Eurostat’s environmental sector handbook, which contains definitions of which economic activities and products are included in the environmental sector. Examples of economic activity included are production of renewable energy, wastewater treatment, waste management, sanitation, environmental consultants, and organic farming. Examples of economic activity not included are wholesale of waste products, nuclear power, and public transport.
To read more on definitions and delimitations, see Eurostat’s handbook:
Next publishing will be
The next publication on the environmental sector up to 2022 will take place in 2024.
Statistical Database
More information is available in the Statistical Database
Feel free to use the facts from this statistical news but remember to state Source: Statistics Sweden.
