Financial Accounts first quarter 2024
Households' financial net wealth increased
Statistical news from Statistics Sweden 2024-06-20 8.00
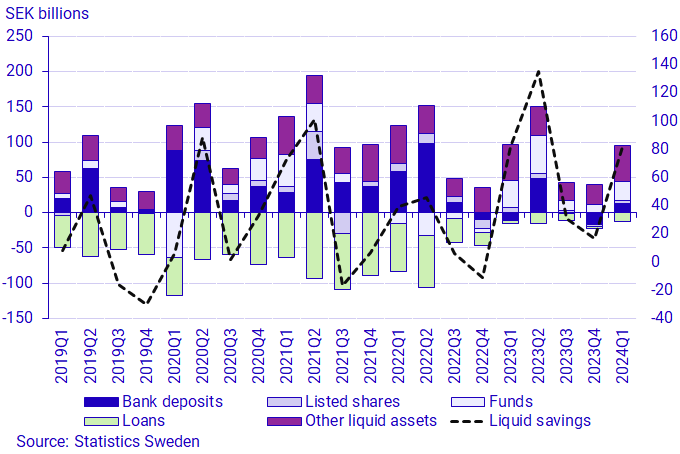
Household liquid savings amounted to SEK 82 billion in the first quarter of 2024, which is at the same level as in the first quarter of the previous year. Households' financial net wealth as a percentage of GDP increased by 21 percentage points compared with the same period of the year before. The government debt ratio has steadily decreased since the start of the time series in 1996, at the same time as the distribution of debt between the central and local government has changed over time.
Household liquid savings, i.e. their financial liquid assets minus liabilities, amounted to SEK 82 billion in the first quarter of 2024. During the quarter, households net bought shares and funds, as well as made net deposits in bank accounts. Household net borrowing, i.e. their new loans minus amortization, remained low in the first quarter and amounted to SEK 13 billion. This is an increase of SEK 10 billion compared to the previous quarter and an increase of SEK 9 billion compared to the corresponding quarter in 2023.
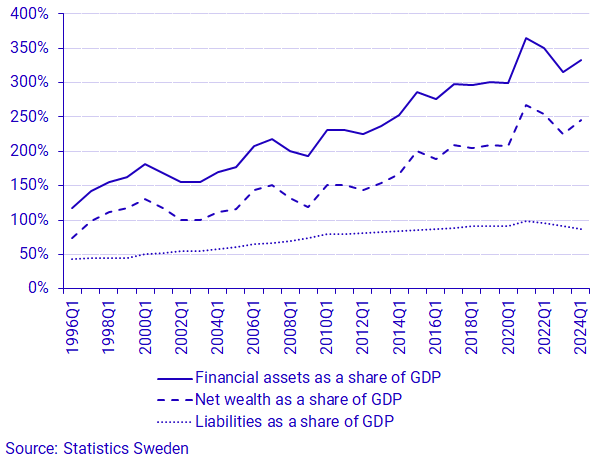
From the first quarter of 1996 to the first quarter of 2024, the household debt-to-GDP ratio has doubled, increasing from 43 percent to 88 percent. During the same period, financial net wealth as a share of GDP has more than tripled, going from 75 percent to 246 percent. This means that household financial assets have increased at a faster rate than liabilities. During the pandemic, this difference in growth rate increased in connection with the price increases in assets such as stocks and tenant-owned apartments.
At the end of the first quarter of 2024, households' financial net wealth amounted to SEK 15 380 billion, which corresponds to 246 percent of GDP. This is an increase of 21 percentage points compared with the same period last year, but a decrease of 21 percentage points compared with the first quarter of 2021, when the financial net wealth was at its highest for a first quarter.
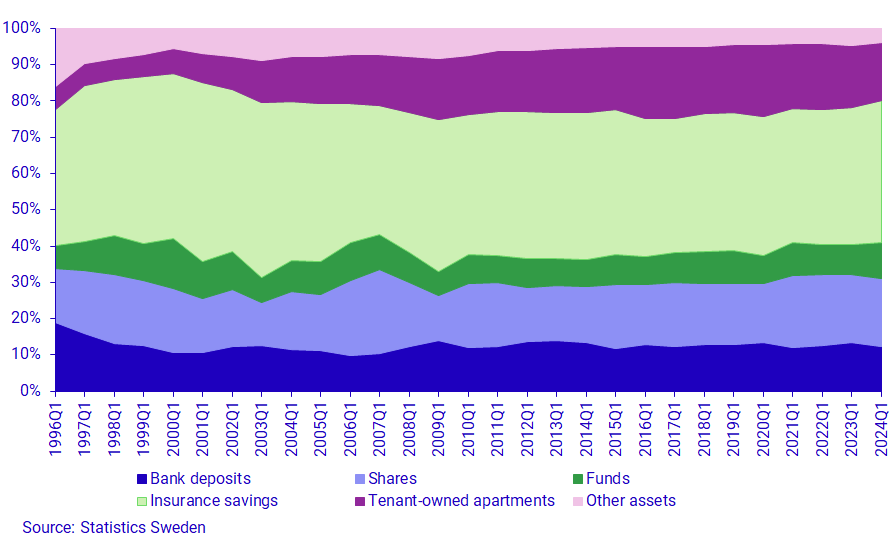
The distribution between household financial assets has been stable over time. Despite the fact that the stock market, according to Affärsvärldens Generalindex, has increased by an average of 8 percent per year since 1996, the share of stock in households' financial assets has not increased by more than 4 percentage points during the same period.
Between 1996 and 2000, the share of tenant-owned apartments in households' financial assets was relatively stable at around 6 percent. After 2000, the share of tenant-owned apartments gradually increased, to 20 percent of total assets in the first quarter of 2017. Since 2017, the share of tenant-owned apartments in households' financial assets has decreased slightly to 16 percent in the first quarter of 2024.
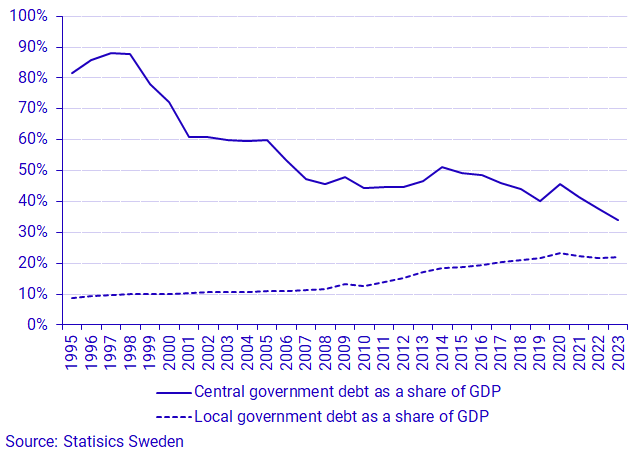
The government debt ratio, which is the total market-valued government debt as a percentage of GDP, has decreased by 48 percentage points since the start of the time series. The traces of the financial crisis in the 1990s, caused the government to be 82 percent of GDP in 1995, before peaking in 1998 at 88 percent.
Since 1998, the government debt ratio has declined. In some years, it has slightly increased, only to decrease again. Between 2019 and 2020, the government debt ratio increased by six percentage points, from 40 percent to 46 percent. This is the largest increase in the government debt ratio between two years. One reason is that the government borrowed more this year as a result of the pandemic that broke out in 2020. Since 2020, the central government debt ratio has decreased by four percentage points per year, and at the end of 2023 it amounted to 34 percent of GDP, which is the lowest ratio since 1995.
The total market-valued debt of local government as a percentage of GDP has had a steadier development since the start of the time series, from 9 percent in 1995 to 22 percent in 2023. The only decrease in the time series is between 2020 and 2021, the period when local government received grants from the central government due to the coronavirus pandemic.
In the first quarter of 2024, the central government debt ratio continued to decline and ended up at 34 percent. The local government debt ratio was at the same level as at the end of 2023, at 22 percent.
Financing of non-financial corporations
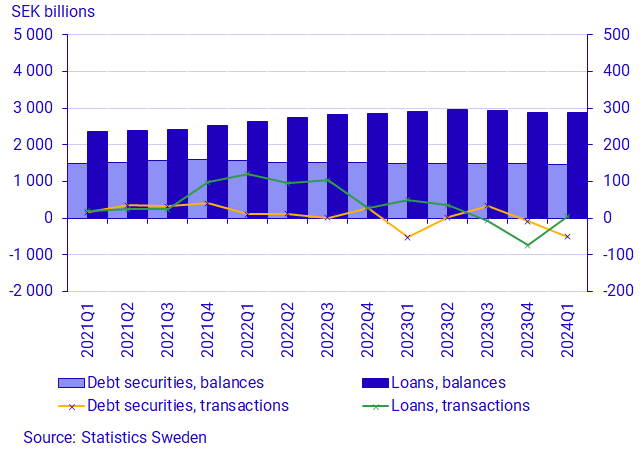
In the first quarter of 2024, the value of non-financial corporations' financing through loans, new loans minus amortization, from monetary financial institutions was SEK 5 billion. This marks an increase compared to the previous quarter, when this value was minus SEK 74 billion, and a significant decrease from the corresponding quarter last year, when this value was SEK 51 billion.
Financing through interest-bearing securities, new issues minus maturities and repurchases, amounted to minus SEK 50 billion. This is SEK 42 billion lower than in the previous quarter and SEK 3 billion higher than in the corresponding quarter last year.
Total loans from monetary financial institutions amounted to SEK 2 877 billion at the end of the quarter. The value of issued debt securities amounted to SEK 1 474 billion.
Revisions
In connection with the publication of the Financial Accounts for the first quarter of 2024, revisions have been made back to 1995 in order to improve the statistics where new data has become available. The revisions affect both the time series for years and quarters.
Structural business statistics has been revised back to 2019.
Retained dividends and transactions in pension rights have been revised with larger amounts back to 2017, which affects household sector savings.
For securities holdings, data has been revised from 2019, and regarding issued securities, revisions go back to 2015.
For local government, the entire time series has been revised for long-term loans on the liability side. The revision is due to municipalities reclassifying old operating lease agreements as financial lease agreements. The time series has also been revised, among other things, with regard to occupational pensions.
Central government has been revised with new data from the Swedish National Financial Management Authority (ESV), including general pension contributions from 2000, and emission allowances from 2012. Other items have been revised back as far as 2005.
The rest of the world sector has been revised back to 2013 with new data from the Balance of Payments.
Definitions and explanations
In the statistical news, reference is made to the liquid financial savings of households. It is calculated as the difference between transactions in financial assets and liabilities excluding accruals (tax accruals, occupational pensions and other technical provisions). For more information, see the Financial Accounts Quality Declaration, section 1.2.2.
The aim of financial accounts is to provide information on financial assets and liabilities as well as changes in financial savings and financial wealth for different sectors of society. The statistics are presented in current prices and do not take inflation into account.
The financial savings in financial accounts is calculated as the difference between transactions in financial assets and liabilities. In the Real Sector Accounts, which, like the Financial Accounts, are part of the National Accounts, financial savings are calculated as the difference between income and expenses. However, financial accounts and real sector accounts are based on different sources, which gives rise to differences between these two products.
In the Financial Accounts, the government debt is calculated differently from the government debt metric that is most frequently reported and which is calculated according to the convergence criteria – the ‘Maastricht debt’. The definition of the Maastricht debt does not include all financial instruments, the instruments are presented in nominal value and the liabilities for government administration are consolidated. The government debt in the Financial Accounts is unconsolidated and includes all financial instruments at market value.
In addition to the government agencies, the government administration sector also includes certain state foundations and state-owned companies. Government administration does not include entities within the retirement pension system. Instead, they make up the social security funds sector. Municipal administration includes primary municipal authorities, regional authorities (formerly county council authorities), municipal associations and certain municipal foundations and certain municipally or regionally owned companies.
More information: National wealth
The National Wealth, which contains annual data on non-financial and financial assets, is also published in connection with the publication of the Financial Accounts. Financial assets and liabilities are collected from the Financial Accounts and are thus consistent with the values published in the Financial Accounts.
For further information, see:
Next publishing will be
The next statistical news in this series is scheduled for publishing on 2024-09-19 at 08.00
Feel free to use the facts from this statistical news but remember to state Source: Statistics Sweden.