Final income and taxes 2017:
Households’ economic standard continues to increase, but at a slower rate than before
Statistical news from Statistics Sweden 2019-01-31 9.30
Households’ economic standard continues to increase, although at a lower rate than in recent years. In 2017, the median amount for the economic standard was SEK 248 400. This is an increase of 0.7 percent since 2016, taking inflation into account. Since 2011, the economic standard has increased by 13 percent, according to new statistics on households’ incomes and taxes.
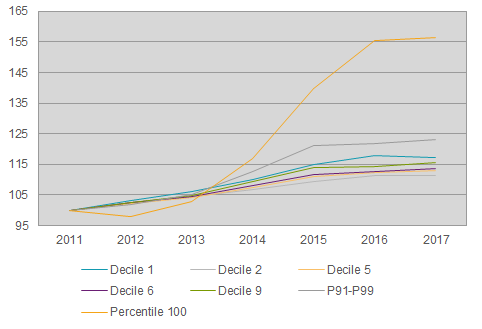
Changes in the economic standard vary among different groups. Between 2016 and 2017, there was a negative change in decile group 1 and 2, that is, the 20 percent of the population with the lowest incomes, while the change was positive for other decile groups. However, all decile groups have had a higher economic standard since 2011 – from the lowest increase, 11 percent in decile group 2, to 33 percent in decile group 10, which is the largest increase. However, the income increase in decile 10 is unevenly distributed, where the hundredth part with the highest income (P100) has had a considerably better growth than the remaining parts of decile 10 (P91–P99).
Strong development for young people without children
Young people without children have had a strong economic development since 2011. The development has been strongest among single women aged 20–29; their economic standard has increased by 25 percent. The corresponding increase among single men was 16 percent, while among cohabiting adults without children in the same age group the economic standard increased by 20 percent between 2011 and 2017.
Single persons aged 65–79 experienced the least favourable economic development. Among women in this group, the increase was 9 percent, while among men it was 10 percent.
Among families with children, single men have had the least favourable development – an increase of 11 percent since 2011. The development for women and cohabiting adults with children was slightly more positive – an increase of 13 percent during the same period.
Foreign born persons keep pace with Swedish born persons
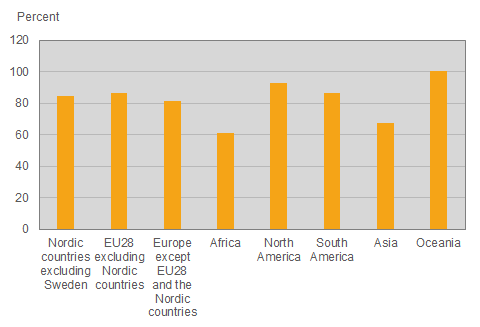
The economic standard has increased by 15 percent for both Swedish born persons and foreign born persons in the period 2011–2017. However, the economic standard among foreign born persons is lower, in general, than among Swedish born persons. It corresponded to 77 percent of the economic standard of Swedish born persons in 2017 – a share that has remained unchanged, on the whole, throughout the period. Among foreign born persons, the length of their stay in Sweden plays an important part for their economic standard. Foreign born persons with a short period of residence have a considerably lower economic standard compared with persons with a longer period of residence. For example, persons born in Africa or Asia who have resided in Sweden for up to ten years have an economic standard that corresponds to 55 percent and 57 percent respectively of the economic standard of Swedish born persons in 2017. Among persons who have resided in Sweden for more than 20 years, the corresponding shares were 79 percent and 86 percent respectively.
Rising income inequality
Income inequality, according to the Gini coefficient, increased from 0.320 to 0.322 between 2016 and 2017. In 2011, the Gini coefficient was 0.294. A large share of this increase can be explained by increased capital income, in which capital gains comprise a significant part. When capital gains are excluded, the Gini coefficient remains unchanged between 2016 and 2017, and increased at a considerably slower rate, from 0.266 to 0.279, in the period 2011–2017.
The share of persons at risk of poverty has increased by one percentage point, from 13.9 percent to 14.9 percent, since 2011. However, the poverty gap – which shows the shortfall between the median income of people at risk of poverty and the at-risk-of-poverty threshold – has decreased from 19.8 percent to 18.7 percent in the same period.
Definitions and explanations
The base year used in this statistical news is 2011. The reason for this is that these statistics switched sources in 2011, from a base in a sample survey to a base in a total population survey. This affects comparability over time to some degree, which is why we have chosen to use the start year of total population use as the base year.
Disposable income: The sum of all taxable and non-taxable income less taxes and other negative transfers (such as repaid study loans) of all household members.
Economic standard: A system that takes into account different types of households is applied to make comparisons of disposable income among different types of households. The disposable income is divided by the number of consumption units in the household.
At-risk-of-poverty standard: The at-risk-of-poverty standard refers to the share of persons who live in households with an economic standard that is less than 60 percent of the national median value.
Gini coefficient: The Gini coefficient is used to show inequality in the income distribution. Inequality in distribution can be described with a Lorenz curve, which is used to calculate the Gini coefficient. The coefficient assumes a value between 0 and 1. A high coefficient value implies greater inequality than a low value.
Poverty gap: The poverty gap refers to the gap in percent between the median income of people at risk of poverty and the at-risk-of-poverty threshold. The definition adheres to Eurostat’s definition of the indicator ‘Relative median at-risk-of-poverty gap’.
Statistical Database
More information is available in the Statistical Database
Feel free to use the facts from this statistical news but remember to state Source: Statistics Sweden.