Income and taxes 2019, final
Income growth rate slowing in recent years
Statistical news from Statistics Sweden 2021-01-27 9.30
Households’ economic standard continued to increase in 2019, albeit at a slower rate than in the early 2010s, according to statistics on households’ incomes and taxes.
Households’ economic standard increased by 0.7 percent in 2019, while the increase in the four-year period 2016–2019 was just over 3 percent. An income growth rate this low hasn’t been noted since the economic recession in the 1990s, when the economic standard decreased. In the previous four-year period, 2012–2015, the increase was just over 11 percent.
Somewhat greater income inequality in 2019
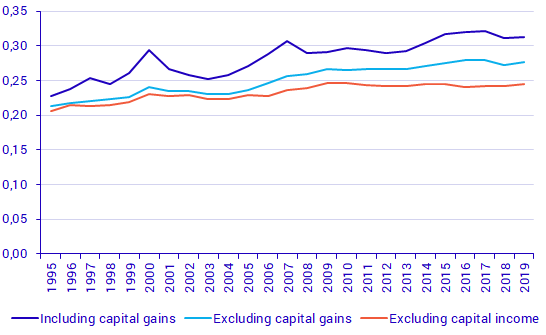
Differences in income, measured using the Gini coefficient, increased somewhat in 2019, although the differences were smaller than in the years 2015–2017. Differences in income also increased when capital gain and all capital income for 2019 respectively were excluded. When all capital income is excluded, then differences in income, measured using the Gini coefficient, have remained relatively stable during the 2010s. However, taken over a longer period, income disparities have increased.

Proportion of people at risk of poverty higher than ever
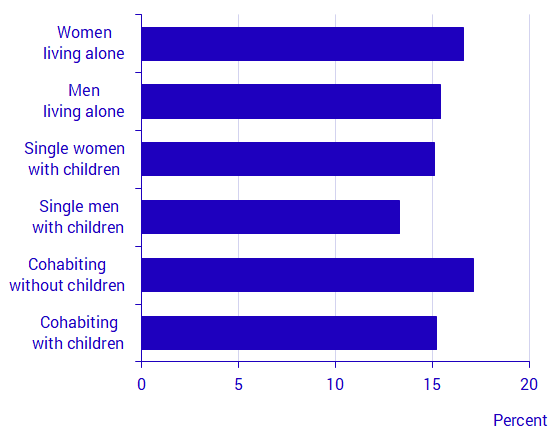
The proportion of people who are at risk of poverty increased in 2019 and exceeded 15 percent for the first time ever. The proportion was between 13 percent and 15 percent in the years 2008–2018. A major increase occurred between 2003 and 2011, when the share increased from 8.9 percent to 14.4 percent. In many population groups, the proportion of people at risk of poverty is considerably larger than 15 percent. For example, among single women aged over 80 years this proportion is 41 percent, and among children aged 0–19 years, the proportion was 20 percent. Among cohabiting adults without children, on the other hand, this proportion was only 5 percent.
More than 25 percent of income among highest income decile
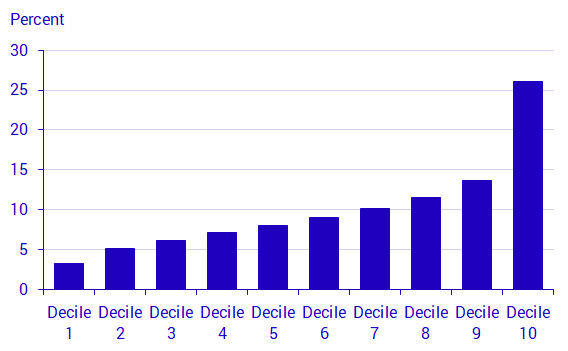
In 2019, the half of the population with the lowest income had just under 30 percent of total disposable income in Sweden. This share has remained relatively constant in the past ten years; in the late 1990s, it was 34 percent. The decile of the population with the highest income had just over 26 percent of total disposable income, which is one percentage point lower than in 2016 and 2017, while it is an increase of three percentage points since the end of the 1990s.

Income gap between Swedish born persons and foreign born persons remains constant
The economic standard is lower among foreign born persons than among Swedish born persons. In 2019, the economic standard among foreign born persons aged 20 years and older corresponded to 77 percent of the economic standard among Swedish born persons. This share has remained relatively constant in the past ten years. However, around 2000, this proportion was considerably higher, approximately 85 percent.
Most progress among young women
Between 2011 and 2019, there was strong economic progress among young women. Income growth among single women aged 20–29 years without children was 30 percent. The corresponding increase among young men aged 20–29 years without children was 20 percent. The development among single persons aged 65–79 years was less favourable. Their economic standard increased by 13 percent between 2011 and 2019, about the same for women and for men. Income growth was somewhat less favourable between 2011 and 2019 for households with children than for households without children.

* See statistics broken down by age here:
Definitions and explanations
Disposable income: The sum of all taxable and non-taxable income less taxes and other negative transfers (such as repaid study loans) of all household members.
Economic standard: For a comparison of disposable income between different types of households, disposable income of the household is placed in relation to the number of adults and children in the household.
At-risk-of-poverty rate: The at-risk-of-poverty rate refers to the share of people who live in households with an economic standard that is less than 60 percent of the national median value.
Gini coefficient: The Gini coefficient is used to show inequality in the income distribution. The coefficient is a value between 0 and 1. A high coefficient value indicates greater inequality than a low value.
Statistical Database
More information is available in the Statistical Database
Feel free to use the facts from this statistical news but remember to state Source: Statistics Sweden.
