Population by Labour market status, 3rd quarter 2022
Additional statistics from BAS
Statistical news from Statistics Sweden 2022-12-13 8.00
New statistics showing the number of employed people by the workplace’s industry and location are published in the product Population by Labour market status (BAS).
The new statistics contain estimates of the number of employed people aged 15–74 by sex, industrial classification NACE Rev. 2 (15 groups) and the location of the workplace (Sweden, county, municipality). The time series for month, quarter and year are available from January 2020 to September 2022.
BAS is a statistical product that describes, using administrative data from several public authorities, the status of the labour market for the registered population in Sweden.
Initially, BAS are statistics under development, but with plans to present them as official statistics eventually.
Employment in different industries
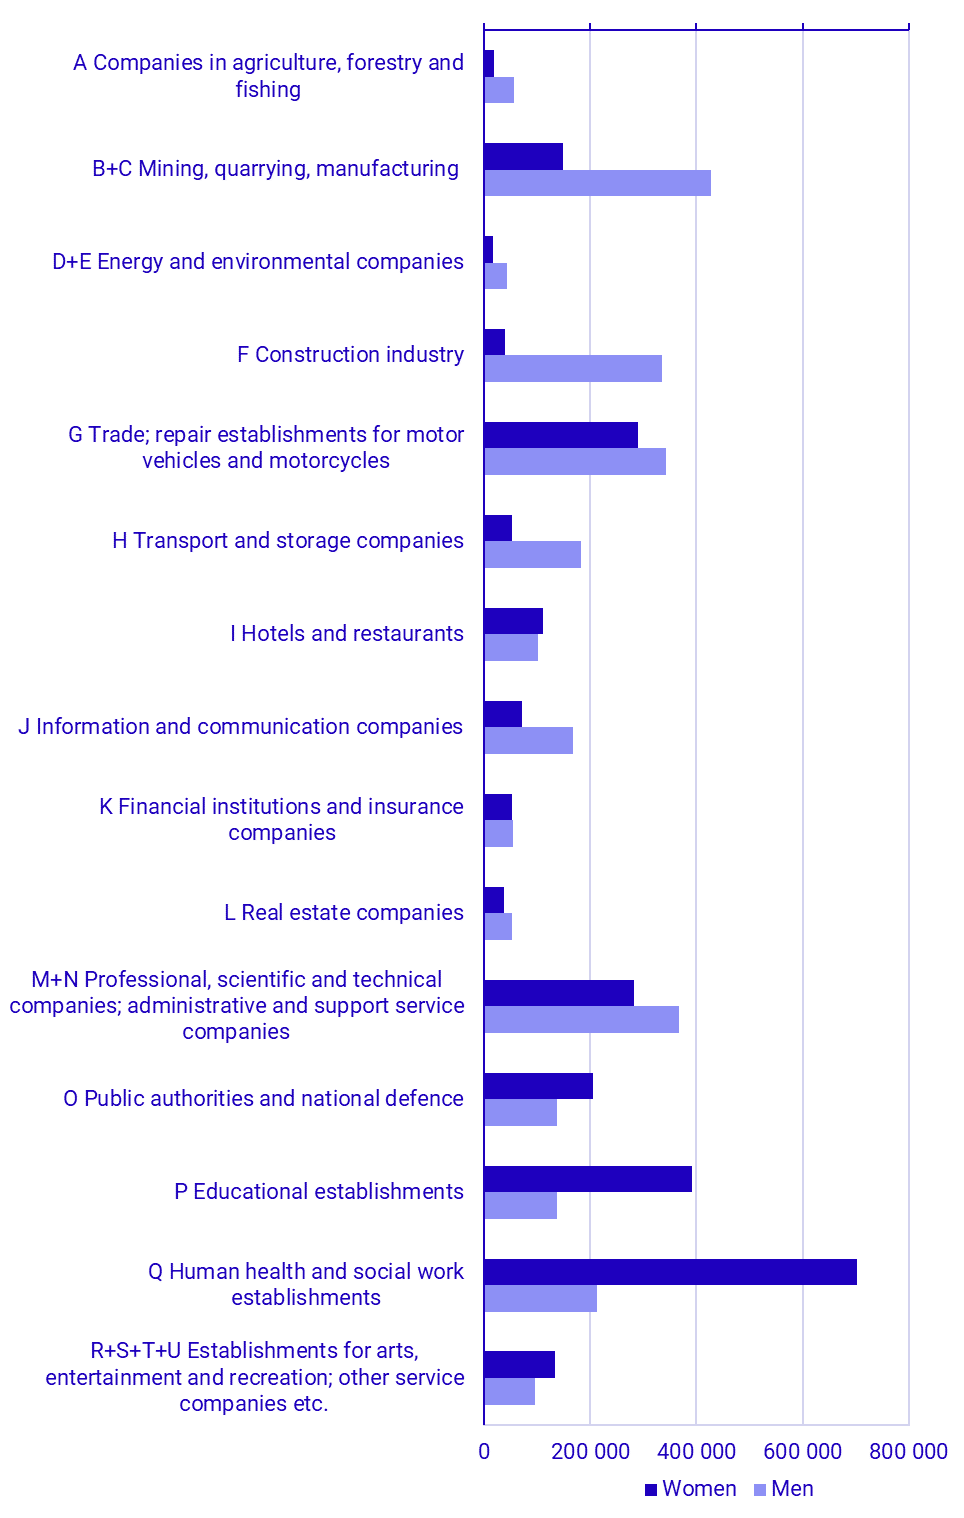
In the third quarter of 2022, the industry Human health and social work establishments employed most people in Sweden, 914 000 individuals. It was also the industry in which most women were employed. Most employed men, however, were found in the industry Mining, quarrying, manufacturing.

Hotels and restaurants was the industry that increased most in terms of number of employed in the third quarter of 2022 compared with the same period of the year before. In that industry, the number of employed people increased by 17.9 percent. The number of women increased by 20.5 percent while the number of men increased by 15.2 percent.
The number of employed decreased in only two industries in the third quarter of 2022 compared with the same period of the previous year. Companies in agriculture, forestry and fishing decreased by 1.4 percent and Human health and social work establishments decreased 0.4 percent.
| Industrial classification NACE Rev. 2 | Women | Men | Total |
|---|---|---|---|
| A Companies in agriculture, forestry and fishing | 0.3 | ‑1.9 | ‑1.4 |
| B+C Mining, quarrying, manufacturing | 4.3 | 1.7 | 2.4 |
| D+E Energy and environmental companies | 5.7 | 3.0 | 3.7 |
| F Construction industry | 4.9 | 2.2 | 2.5 |
| G Trade; repair establishments for motor vehicles and motorcycles | 3.1 | 1.9 | 2.4 |
| H Transport and storage companies | 1.5 | 1.2 | 1.3 |
| I Hotels and restaurants | 20.5 | 15.2 | 17.9 |
| J Information and communication companies | 8.0 | 6.1 | 6.7 |
| K Financial institutions and insurance companies | 4.5 | 5.5 | 5.0 |
| L Real estate companies | 2.0 | 0.1 | 0.9 |
| M+N Professional, scientific and technical companies; administrative and support service companies | 7.0 | 5.9 | 6.4 |
| O Public authorities and national defence | 2.3 | 1.1 | 1.8 |
| P Educational establishments | 0.3 | ‑0.3 | 0.1 |
| Q Human health and social work establishments | ‑0.6 | 0.3 | ‑0.4 |
| R+S+T+U Establishments for arts, entertainment and recreation; other service companies etc. | 5.9 | 5.8 | 5.8 |
Hotels and restaurants
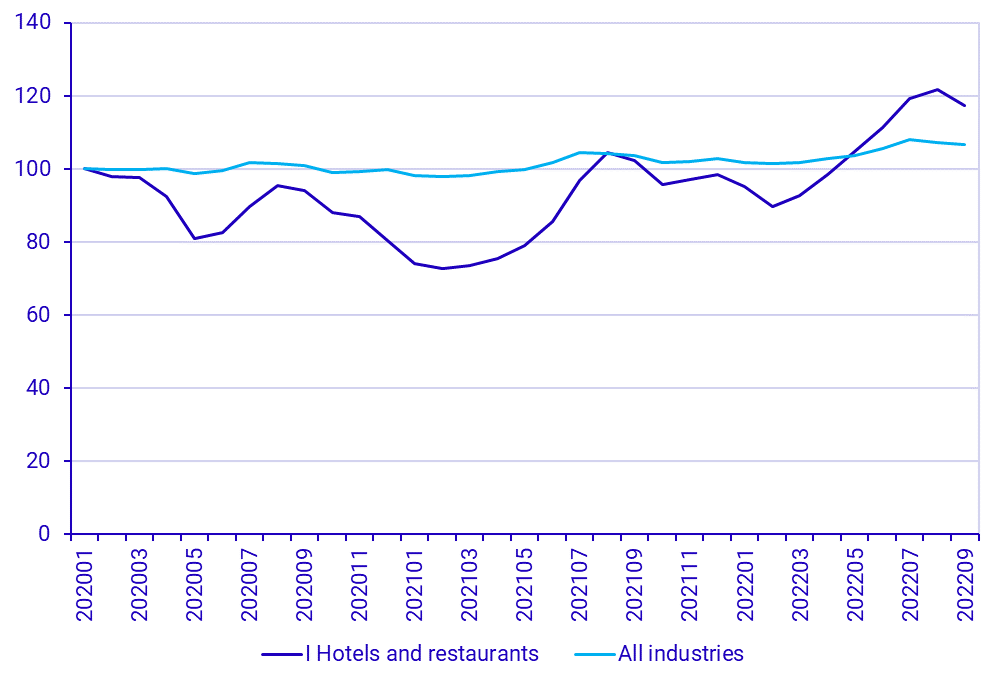
Hotels and restaurants have, during the period January 2020 to September 2022, varied in terms of the number of people employed. In the chart below, the number of people employed each month is placed in relation to the number of people employed in January 2020, as an index. This enables following, in the same chart, the number of people employed for different study domains from January 2020 to September 2022.

The number of employed people in Hotels and restaurants decreased after the outbreak of the pandemic in the spring of 2020. In August and September 2021 the number of employed people in the industry was, for the first time, higher than before the pandemic, and then decreased again in the autumn of 2021. From May 2022, however, Hotels and restaurants have employed more people than in January 2020. The chart above also shows the progression for All industries. That line does not vary in the same way as the individual industry, but increases only slightly during the period.
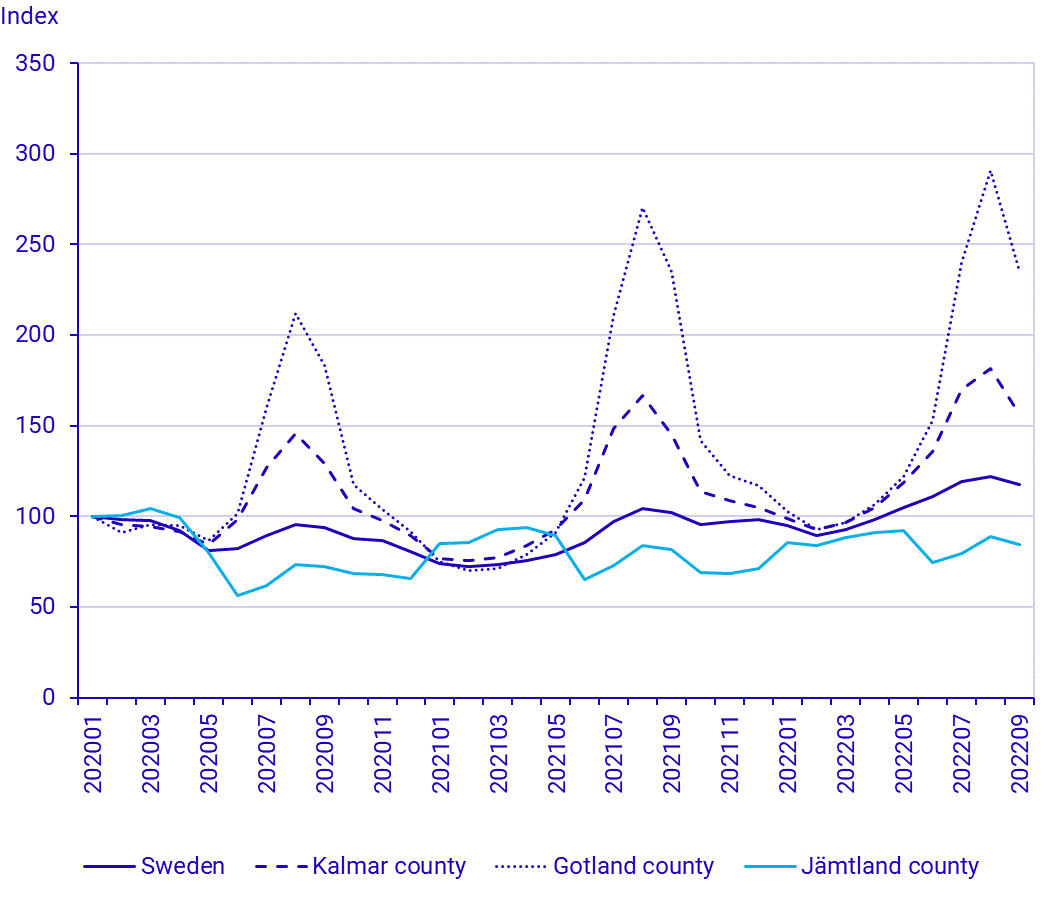
There are considerable regional differences in the progression of the Hotels and restaurants industry. The chart below shows examples of some counties with a large variation in the number of people employed over the year. Counties that perceivably have a high level of summer tourism, such as Gotland and Kalmar counties, have more people employed during the summer months than in other periods of the year, while Jämtland county has more people employed during the winter than in other periods of the year.

Feel free to use the facts from this statistical news but remember to state Source: Statistics Sweden.
