Social security in Sweden 1993–2020 (corrected 2022-04-22)
Expenditure on social protection increased in relation to GDP
Statistical news from Statistics Sweden 2022-03-31 8.00
Social protection expenditures as a share of GDP increased from 27.7 percent in 2019 to 29.6 percent in 2020. Social protection expenditures in current prices increased, while the GDP decreased.
In 2020, total expenditures on social protection increased by SEK 77.9 billion, which corresponds to 5.6 percent. The corresponding increase between 2018 and 2019 was 2.5 percent. Total expenditures for social protection amounted to SEK 1 476 billion in 2020.
Expenditures on social protection as a share of GDP has varied from year to year. The share fell from 35.6 percent in 1993 to 29.6 percent in 2020. Between 1993 and 2000, the share decreased steadily, and amounted to 28.0 percent in 2000. In the 2000s, the share varied between 27.2 percent (in 2007) and 30.1 percent (in 2003).
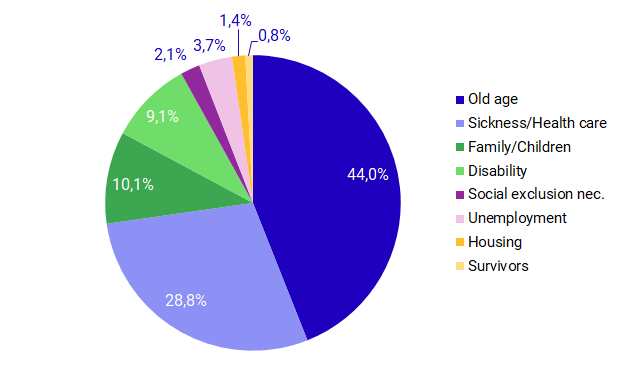
Expenditure on the elderly was the largest expenditure item
The largest expenditure item was the elderly, which amounted to 44 percent of social benefits in 2020. The second largest expenditure item was health and medical care, which accounted for 29 percent of total social benefits. This was followed by expenditure on family/children and disability, which accounted for 10 percent and 9 percent of total social benefits respectively.
Expenditures on the elderly increased by SEK 29.2 billion, an increase of 4.8 percent between 2019 and 2020. Old age pension, which is the largest item of expenditure on old age, increased by SEK 24.3 billion, which corresponds to 5.3 percent.
Health care
Expenditures on health and medical care increased by SEK 38 billion, which corresponds to 10 percent. Expenditures on both inpatient and outpatient care increased. Inpatient care increased by SEK 9.9 billion, which corresponds to 8.2 percent more than last year. Outpatient care increased by SEK 6.8 billion, which corresponds to 3.7 percent. Expenditures on paid sick leave increased by SEK 19.6 billion in the same period. The increase was largely due to the Covid-19 pandemic. In 2020, the government partly reimbursed employers’ expenditure for paid sick pay leave as a financial support during the pandemic. As a result, employers’ expenditures on paid sick pay leave decreased by SEK
8 billion in 2020, while government expenditure for the benefits in question saw an increase by SEK 22 billion.
Disability
In 2020, expenditures on disability decreased by SEK 0.8 billion, which corresponds to 0.6 percent. The item comprising assistance in carrying out daily tasks decreased by SEK 0.5 billion, which corresponds to 1.3 percent, in 2020, while Accommodation increased by SEK 1.5 billion, which corresponds to 5.2 percent. Cash benefits in the form of disability pension continued to decrease; in 2020 this decrease amounted to SEK 1.4 billion.
Family/Children
Expenditures on family and children increased by SEK 0.3 billion, corresponding to an increase of 0.2 percent between 2019 and 2020. Cash benefits decreased in 2020, except for Family or child allowance, which increased by SEK 0.2 billion, corresponding to an increase of 0.5 percent.
Benefits in kind increased 2020. Expenditure for Accommodation had the largest increase by SEK 0.9 billon, corresponding to 5.4 percent. Expenditure for Child care for preschool children amounted roughly to SEK 52 billion and remained more or less unchanged between 2019 and 2020.
Social exclusion
Expenditures on other social exclusion continued to decrease in 2020. Expenditures also decreased between 2017 and 2019, following two years of relatively large increases due to a high level of immigration. The decrease in 2020 was mainly related to decreased expenditures on accommodation and other social services as a result of fewer asylum seekers. Between 2019 and 2020, expenditures on Accommodation decreased by SEK 1.5 billion, which corresponds to 21 percent, and Other social services decreased by 2.0 billion, which corresponds to 34 percent. Total expenditures on social exclusion decreased by SEK 3.7 billion, which corresponds to 10.6 percent.
Unemployment
In 2020, total expenditures on unemployment increased by 13.1 billon or roughly 33 percent, compared to 2019. Expenditures on Full employment benefits comprised the largest part by 10.4 billion, corresponding to an increase of more than 69 percent. The large increase was due to rising unemployment during the pandemic. The government and the parliament also decided to temporarily ease certain conditions in the unemployment benefit, which enabled more people to receive the benefit. Expenditures on Vocational training allowance and Redundancy compensation increased by 1.9 and 0.9 billion respectively, which corresponded to increases by 14 and 44 percent.
| Function | 2015 | 2016 | 2017 | 2018 | 2019 | 2020 |
|---|---|---|---|---|---|---|
| 1. Sickness/Health care | 315 392 | 330 674 | 341 184 | 360 613 | 378 513 | 416 484 |
| 2. Disability | 128 813 | 127 193 | 129 644 | 133 179 | 132 915 | 132 069 |
| 3. Old Age | 522 682 | 546 730 | 573 276 | 588 212 | 607 915 | 637 128 |
| 4. Survivors | 14 081 | 13 685 | 13 375 | 12 767 | 12 412 | 12 050 |
| 5. Family/Children | 125 133 | 130 987 | 131 962 | 141 564 | 145 810 | 146 086 |
| 6. Unemployment | 44 106 | 45 152 | 45 402 | 42 272 | 39 776 | 52 881 |
| 7. Housing | 18 614 | 18 307 | 18 269 | 19 168 | 19 043 | 20 858 |
| 8. Social exclusion nec. | 39 713 | 59 937 | 48 884 | 39 450 | 34 570 | 30 891 |
| Expenditures for social protection benefits | 1 208 534 | 1 272 665 | 1 301 996 | 1 337 225 | 1 370 954 | 1 448 447 |
| As a % of GDP | 28.4 | 28.8 | 28.2 | 27.7 | 27.1 | 29.0 |
| Administration costs/Other expenditures | 24 536 | 25 218 | 26 577 | 26 715 | 27 124 | 27 565 |
| Social protection expenditure | 1 233 070 | 1 297 883 | 1 328 573 | 1 363 940 | 1 398 078 | 1 476 012 |
| As a % of GDP | 28.9 | 29.4 | 28.7 | 28.2 | 27.7 | 29.6 |
International comparisons
In the early 1990s, Sweden had the highest level of social protection expenditure in relation to GDP compared with other countries in the EU. In recent years, Sweden’s expenditures have been just below the EU average. In 2019, France had the highest level of expenditure on social protection as a share of GDP, at 33.6 percent. Denmark had the second highest levels of expenditure on social protection, at 31.3 percent of GDP. For Germany with the third highest share, the share was 30.3 percent. Ireland was the EU country with the smallest share, 13.6 percent. Romania had the second lowest share, at 15.3 percent.
The different taxation regulations pose a major problem for international comparisons. Some countries regulate taxes on certain benefits, while others do not. In addition, some benefits in certain countries consist of tax deductions, while other countries pay the benefit directly. Slightly more than half of the social protection benefits in Sweden are cash benefits. Most of these cash benefits are taxable. If taxation is taken into account, the percentage of GDP from benefits in 2020, excluding administration costs, fell from 29.0 percent including tax to 25.7 percent excluding tax.
Definitions and explanations
Social protection is defined here as all services from public or private organisations with the purpose of reducing the burden on households and individuals from specially defined risks or meeting specially defined needs. A prerequisite is that these services do not require a return of services and that they are not based on individual arrangements. The benefits may be either in cash or in kind.
Feel free to use the facts from this statistical news but remember to state Source: Statistics Sweden.