Families with children finances 2014–2023
Fewer children live in households unable to afford essential living expenses
Statistical news from Statistics Sweden 2025-03-21 8.00
Over ten years, the number of children living in families with low-income standards has decreased by 50,000.
Low-income standard is an absolute measure of poverty used to identify households whose disposable income is insufficient to cover necessary expenses. When calculating income standard, the household's disposable income is compared to the living costs for all household members. These living costs are estimated using standard amounts for food, housing, home insurance, childcare, local travel, and so on. It is not the household's actual expenses. For example, a family consisting of two adults and two children, aged 3 and 6, is considered to have a low income standard if their disposable income is below 26,600 SEK per month, based on 2023 figures. For a single parent with two children, the threshold is 22,200 SEK. This example refers to a family living in a municipality with more than 75,000 inhabitants, excluding Greater Stockholm, Greater Gothenburg, and Greater Malmö. The 2023 values are referenced because Statistics Sweden (SCB) updated the statistical database with the economic conditions of families with children for that year.
In 2023, there were 145,000 children under the age of 18 living in households with a low-income standard. Of these, slightly more are boys than girls. The number of children living in households with a low-income standard has decreased by nearly 50,000 over a ten-year period
Number of children aged 0–17 living in households with a low-income standard from 2014 to 2023
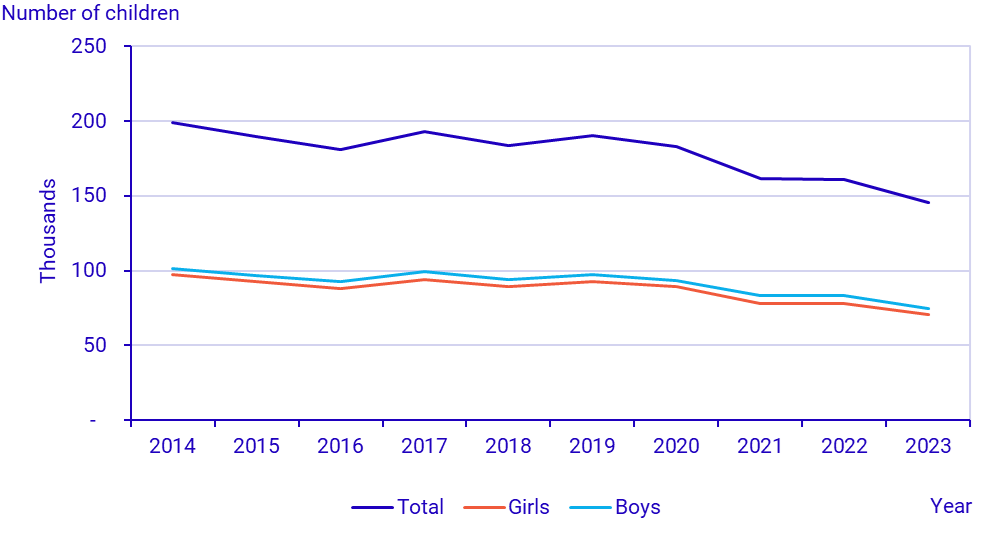
| 2014 | 2015 | 2016 | 2017 | 2018 | 2019 | 2020 | 2021 | 2022 | 2023 | |
|---|---|---|---|---|---|---|---|---|---|---|
| Total | 199 | 189 | 181 | 193 | 184 | 190 | 183 | 161 | 161 | 145 |
| Girls | 97 | 93 | 88 | 94 | 89 | 93 | 89 | 78 | 78 | 71 |
| Boys | 102 | 97 | 93 | 99 | 94 | 97 | 94 | 83 | 83 | 75 |
The proportion of children living in households with a low-income standard is unevenly distributed across the municipalities in Sweden. In the municipality with the highest proportion of children living in households with a low-income standard, nearly one in five children lives in such a household. In municipalities with the lowest proportions, it is only one in fifty.
See the proportion for your municipality
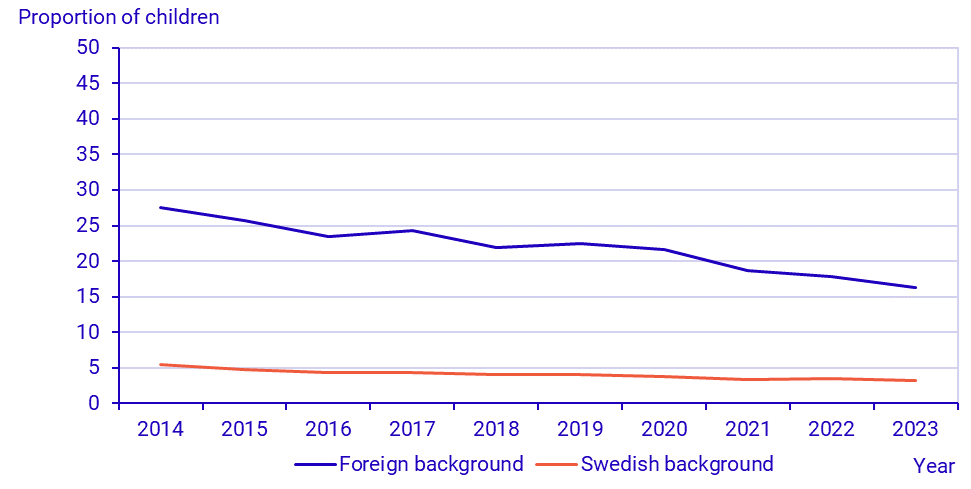
The proportion of children living in households with a low-income standard also varies depending on whether they have a Swedish or foreign background. Over ten years, there has been a decrease from 28 to 16 percent for children with a foreign background. During the same period, there has also been a decrease among children with a Swedish background, from five to three percent. As shown in the table below, there are no significant differences in proportions between girls and boys.
Proportion of children aged 0–17 living in households with a low-income standard by foreign/Swedish background 2014–2023
| 2014 | 2015 | 2016 | 2017 | 2018 | 2019 | 2020 | 2021 | 2022 | 2023 | ||
|---|---|---|---|---|---|---|---|---|---|---|---|
| All | |||||||||||
| Foreign background | 28 | 26 | 23 | 24 | 22 | 22 | 22 | 19 | 18 | 16 | |
| Swedish background | 5 | 5 | 4 | 4 | 4 | 4 | 4 | 3 | 4 | 3 | |
| Total | 10 | 9 | 9 | 9 | 9 | 9 | 8 | 7 | 7 | 7 | |
| Girls | |||||||||||
| Foreign background | 28 | 26 | 24 | 24 | 22 | 23 | 22 | 19 | 18 | 16 | |
| Swedish background | 5 | 5 | 4 | 4 | 4 | 4 | 4 | 3 | 4 | 3 | |
| Total | 10 | 9 | 9 | 9 | 9 | 9 | 8 | 7 | 7 | 7 | |
| Boys | |||||||||||
| Foreign background | 27 | 26 | 23 | 24 | 22 | 22 | 22 | 19 | 18 | 16 | |
| Swedish background | 5 | 5 | 4 | 4 | 4 | 4 | 4 | 3 | 4 | 3 | |
| Total | 10 | 9 | 9 | 9 | 9 | 9 | 8 | 7 | 7 | 7 |
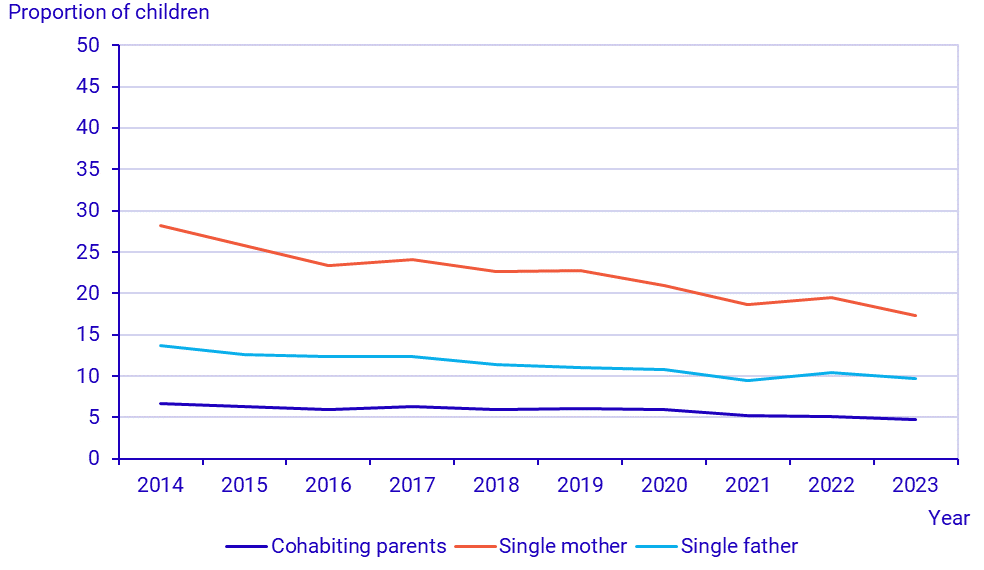
At the group level, there are also differences in income standards depending on household composition. The largest proportion of children living in households with a low-income standard is found among those living with a single mother. In 2014, 28 percent of all children living with a single mother were in a household with a low-income standard; ten years later, this proportion is 17 percent. There are no significant differences in proportions between girls and boys.
Proportion of children aged 0–17 living in households with a low-income standard by household type 2014–2023
| 2014 | 2015 | 2016 | 2017 | 2018 | 2019 | 2020 | 2021 | 2022 | 2023 | ||
|---|---|---|---|---|---|---|---|---|---|---|---|
| All | |||||||||||
| Cohabiting parents | 7 | 6 | 6 | 6 | 6 | 6 | 6 | 5 | 5 | 5 | |
| Single mother | 28 | 26 | 23 | 24 | 23 | 23 | 21 | 19 | 19 | 17 | |
| Single father | 14 | 13 | 12 | 12 | 11 | 11 | 11 | 9 | 10 | 10 | |
| Total | 10 | 9 | 9 | 9 | 9 | 9 | 8 | 7 | 7 | 7 | |
| Girls | |||||||||||
| Cohabiting parents | 7 | 6 | 6 | 6 | 6 | 6 | 6 | 5 | 5 | 5 | |
| Single mother | 28 | 26 | 23 | 24 | 23 | 23 | 21 | 19 | 19 | 17 | |
| Single father | 14 | 13 | 12 | 12 | 11 | 11 | 11 | 9 | 10 | 9 | |
| Total | 10 | 9 | 9 | 9 | 9 | 9 | 8 | 7 | 7 | 7 | |
| Boys | |||||||||||
| Cohabiting parents | 7 | 6 | 6 | 6 | 6 | 6 | 6 | 5 | 5 | 5 | |
| Single mother | 28 | 26 | 24 | 24 | 23 | 23 | 21 | 19 | 20 | 17 | |
| Single father | 14 | 13 | 12 | 12 | 12 | 11 | 11 | 9 | 11 | 10 | |
| Total | 10 | 9 | 9 | 9 | 9 | 9 | 8 | 7 | 7 | 7 |
Parental education is another factor related to the economic conditions of families with children at the group level. The largest proportion of children living in households with a low-income standard is found among those living with one or two parents with at most a secondary education. Over ten years, the proportion has decreased from 16 to 12 percent. Here too, there are no significant differences in proportions between girls and boys.
Proportion of children aged 0–17 living in households with a low-income standard by parental education level 2014–2023

| 2014 | 2015 | 2016 | 2017 | 2018 | 2019 | 2020 | 2021 | 2022 | 2023 | ||
|---|---|---|---|---|---|---|---|---|---|---|---|
| All | |||||||||||
| Parent(s) with at most a secondary education | 16 | 15 | 14 | 15 | 14 | 14 | 14 | 13 | 13 | 12 | |
| At least one parent with post-secondary education | 6 | 6 | 5 | 5 | 5 | 5 | 5 | 4 | 4 | 4 | |
| Total | 10 | 9 | 9 | 9 | 9 | 9 | 8 | 7 | 7 | 7 | |
| Girls | |||||||||||
| Parent(s) with at most a secondary education | 16 | 15 | 14 | 15 | 14 | 15 | 14 | 13 | 13 | 12 | |
| At least one parent with post-secondary education | 6 | 6 | 5 | 5 | 5 | 5 | 5 | 4 | 4 | 4 | |
| Total | 10 | 9 | 9 | 9 | 9 | 9 | 8 | 7 | 7 | 7 | |
| Boys | |||||||||||
| Parent(s) with at most a secondary education | 16 | 15 | 14 | 15 | 14 | 14 | 14 | 13 | 13 | 12 | |
| At least one parent with post-secondary education | 6 | 6 | 5 | 5 | 5 | 5 | 5 | 4 | 4 | 4 | |
| Total | 10 | 9 | 9 | 9 | 9 | 9 | 8 | 7 | 7 | 7 |
Definitions and explanations
Disponible Income
Consists of the sum of all taxable and tax-free incomes of all household members minus taxes and other negative transfers (e.g., student loans).
Parental Education Level
Pre-secondary education includes primary school, elementary school, or equivalent. Post-secondary education includes university education and various types of vocational training, such as advanced vocational training, vocational college education, military training, and police training.
Low-Income Standard
Components included in basic consumption according to the national low-income standard (Sv. Baskonsumtion). Basic consumption according to the national norm for social assistance (food, clothing, leisure), housing, household electricity, home insurance, childcare, local travel, union and unemployment fund fees.
Swedish of foreign background
Children with a foreign background are defined as those who are born abroad or born in Sweden with two foreign-born parents. Children with a Swedish background are defined as those born in Sweden with two Swedish-born parents or one Swedish-born and one foreign-born parent.
Next publishing will be
2025-06-19, 08:00.
Feel free to use the facts from this statistical news but remember to state Source: Statistics Sweden.