Demographic Analysis (DEMOG) Remaining life expectancy, by level of education
Life expectancy increases the most among cohabiting with higher education
Statistical news from Statistics Sweden 2022-06-16 8.00
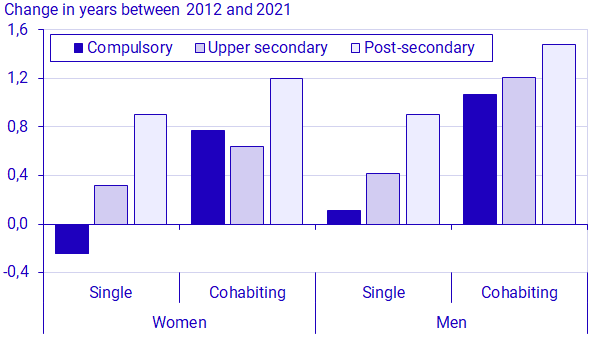
Between 2012 and 2019 life expectancy increased in all education groups, while in 2020 life expectancy fell clearly in all groups. But in 2021 it increased again. For women with post-secondary education and for men with upper secondary education the increase in life expectancy was greater in 2021 than the decline in 2020. Since 2012 life expectancy increased the most among cohabiting with post-secondary education.
Average life expectancy has increased steadily for both women and men. However, in 2020, life expectancy decreased due to a large number of deaths in COVID-19, but in 2021 life expectancy increased again and almost to the same level as 2019.
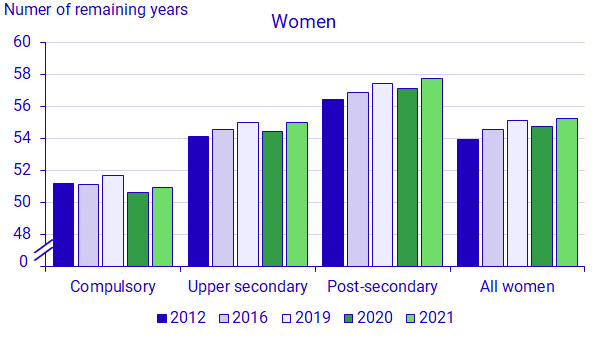
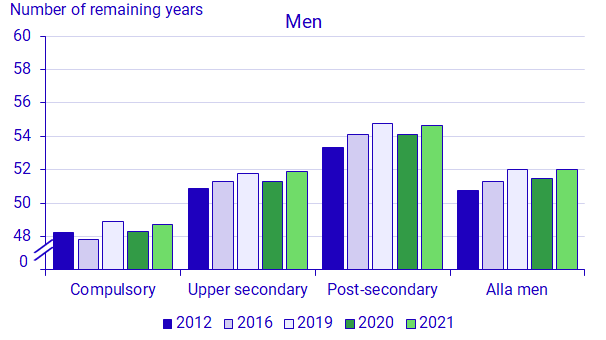
In 2021, remaining life expectancy at age 30 was 55 years for women and 52 years for men. Compared with 2012, life expectancy at 30 years has increased by 0.7 years for both women and men. However, in 2020, life expectancy fell for both women and men compared with the previous year in all educational groups. The reason for the decline was the high mortality rate in the wake of COVID-19. In 2021 life expectancy increased in all groups, and in two groups the increase was greater than the decline in 2020. This was the case for women with post-secondary education and for men with upper secondary education.
There are clear differences in life expectancy between groups with different levels of education. Life expectancy is a few years higher for people with upper secondary education than for those with compulsory education and life expectancy is a few additional years higher for those with post-secondary education than for those with upper secondary education. In the period from 2012 to 2021, the differences between the groups increased somewhat, and more so among women than among men. This is mainly because since 2012, life expectancy for women with post-secondary education has increased clearly, but less for women with upper secondary education and with compulsory education. In 2021, the difference between the groups with post-secondary education and with compulsory education was almost 7 years for women and 6 years for men. The difference in life expectancy between those with post-secondary education and with upper secondary education was 2.7 years for both women and men, which is a somewhat larger difference for both sexes than in 2012.
Largest increase for cohabiting with higher education
Most of the deaths in Sweden occur in old age. Changes in mortality rates in old age contributes the most to a rise or fall of life expectancy, something clearly observed with the COVID-19 pandemic in recent years. When looking at remaining life expectancy at age 65, it has increased by one year between 2012 and 2021, from 21 to 22 years for women and from 18.5 to 19.5 years for men.
In the period 2012–2021 women and men has had the same increase in life expectancy at age 65, but this is not the case for different educational groups. There are also significant differences between those living with a partner or not. At age 65 remaining years of life expectancy increase most for persons living with a partner with post-secondary level of education and least for single persons with compulsory education The increase in life expectancy differs more by level of education for those who are single than for cohabiting. Among men, life expectancy increased more for cohabiting men with compulsory education, from 19.2 to 19.9 years, than for single men with post-secondary education, from 18.0 to 18.5.
Regional differences in life expectancy have been fairly stable over time. From the end of the 1960s to the period 2016-2020, the difference between counties with the highest and the lowest life expectancy has been about 2 years for women and 2.5 years for men. The larger difference for men is due to larger differences in mortality rates at younger ages.
Life expectancy is high in Sweden
Over time, life expectancy has continued to increase, as in most countries. However, in 2020, life expectancy dropped by 0.4 years for women and by 0.7 years for men. This was due to a large number of deaths caused by COVID-19 in 2020, mainly among older people.
In 2019, Sweden was among 20 countries in the world with the highest life expectancy for women and among the top ten countries with the highest life expectancy for men. Life expectancy in Sweden and in many other countries in Europe fell in 2020 compared to 2019 due to a large number of deaths caused by COVID-19. However, life expectancy for both women and men in Sweden remains relatively high compared with other European countries.
Publication
These statistics are published as complete life tables from 30 years in the Statistical Database on Statistics Sweden in the following tables 2012–2021:
• Education level, region of birth (Swedish born and foreign born), sex, year and age
• Education level, household type, sex, and age (limited to the population born in Sweden)
• Level of education, county, sex, five-year period and age (limited to the population born in Sweden)
These statistics are also published in tables and figures with comments on remaining life expectancy at 30 years and at 65 years.
Definitions and explanations
Average remaining life expectancy is normally referred to as “life expectancy”. This is an index that describes mortality in all ages for a year or a specific period. Mortality is shown in a life table and the average number of years remaining is calculated for all ages. Here, the number of remaining years is reported from the age of 30 and 65 years.
The statistics refer to persons aged 30 years and older who were registered in the population various years between 2011 and 2021. Here it is restricted to the population born in Sweden because a larger number of foreign born than native born have missing information on level of education. In the statistical database there are statistics also for the entire population and for foreign born.
These statistics have been produced based on data in Statistics Sweden’s Population Register, Household Register, and Education Register.
Feel free to use the facts from this statistical news but remember to state Source: Statistics Sweden.