Producer and import price index, April 2020
Producer prices affected by lower energy prices and the weakened Swedish currency in April
Statistical news from Statistics Sweden 2020-05-27 9.30
The Producer Price Index was unchanged between March and April 2020. Lower prices on energy-related products were offset by higher export prices on several product groups due to a weakened Swedish currency. The annual rate for the Producer Price Index was -3.0 percent in April 2020 (-3.6 percent in March).
In brief
- Prices decreased on energy-related products
- Prices increased on the export and import markets between March and April due to a weakened Swedish currency
- Prices decreased on all markets compared with the same period a year ago
| Total: B–E* | Change, percent (monthly) |
Change, percent (yearly) |
|---|---|---|
| March 2020– April 2020 |
April 2019– April 2020 |
|
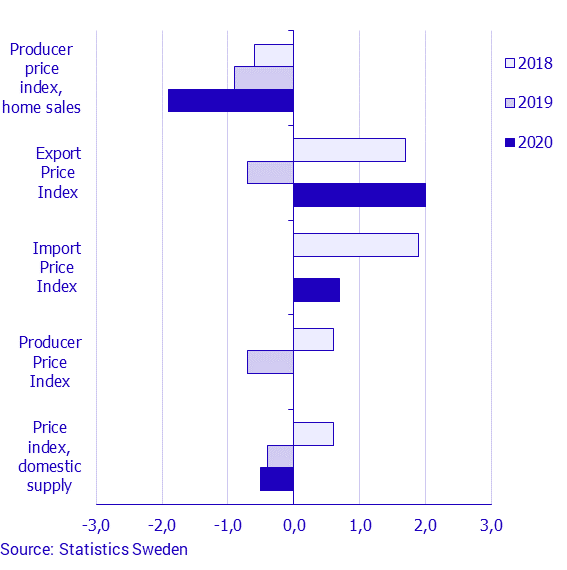
| Producer Price Index | 0.0 | ‑3.0 |
| Producer Price Index, home sales | ‑1.9 | ‑3.5 |
| Export Price Index | 2.0 | ‑2.3 |
| Import Price Index | 0.7 | ‑4.5 |
| Price Index for domestic supply | ‑0.5 | ‑4.0 |
* Products from mining and quarrying, manufactured products, electricity, gas, heating, cooling, water and waste collection.
Changes in the last month
Prices increased on the export and import markets between March and April. This is mainly explained by currency effects that contributed to price increases in several product groups. On the domestic market, the monthly change was instead negative.
On the import market, the main contributions to the upturn came from higher prices on machinery, motor vehicles and computers. Together with food products, electrical equipment, basic metals and fabricated metal products contributed further to the upturn. This was to some extent offset by lower prices on crude oil and pharmaceutical preparations.
On the export market, the main contributions came from price increases on machinery, basic metals and paper and paper products. Chemicals, chemical products and motor vehicles were other products that experienced price increases. At the same time, the upturn was offset by lower prices on electricity.
On the domestic market, prices fell from March to April, mainly due to seasonal price declines in district heating. Other energy-related products, such as electricity and distribution services of electricity, also contributed downwards. This was partly offset by price increases on meat and meat products, fabricated metal products, and parts and accessories for motor vehicles.
Non-response due to the ongoing coronavirus pandemic is considered to be marginal in April.
| Product group according to SPIN 2015 | Largest contributions, in percentage points, to total percentage change, March 2020– April 2020 |
||||
|---|---|---|---|---|---|
| Producer Price Index, home sales |
Export Price Index |
Import Price Index |
|||
| 06.1 | Crude oil | ‑1.3 | |||
| 10 | Food products | 0.2 | |||
| 10.1 | Meat and meat products | 0.1 | |||
| 17 | Paper and paper products | 0.4 | 0.1 | ||
| 20 | Chemicals and chemical products | 0.2 | 0.1 | ||
| 21.2 | Pharmaceutical preparations | ‑0.1 | |||
| 22.2 | Plastic products | 0.1 | |||
| 23 | Other non-metallic mineral products | 0.1 | |||
| 24 | Basic metals | 0.4 | 0.2 | ||
| 25 | Fabricated metal products, except machinery and equipment | 0.1 | 0.1 | 0.2 | |
| 26 | Computer, electronic and optical products | 0.1 | 0.4 | ||
| 27 | Electrical equipment | 0.1 | 0.2 | ||
| 28 | Machinery and equipment n.e.c. | 0.6 | 0.6 | ||
| 29 | Motor vehicles, trailers and semi-trailers | 0.2 | 0.5 | ||
| 29.3 | Parts and accessories for motor vehicles | 0.1 | |||
| 30 | Other transport equipment | 0.1 | |||
| 31 | Furniture | 0.1 | |||
| 35.11 | Electricity | ‑0.5 | ‑0.1 | ||
| 35.13 | Distribution services of electricity | ‑0.2 | |||
| 35.3 | Steam and air conditioning supply services | ‑0.8 | |||
Changes in the last year
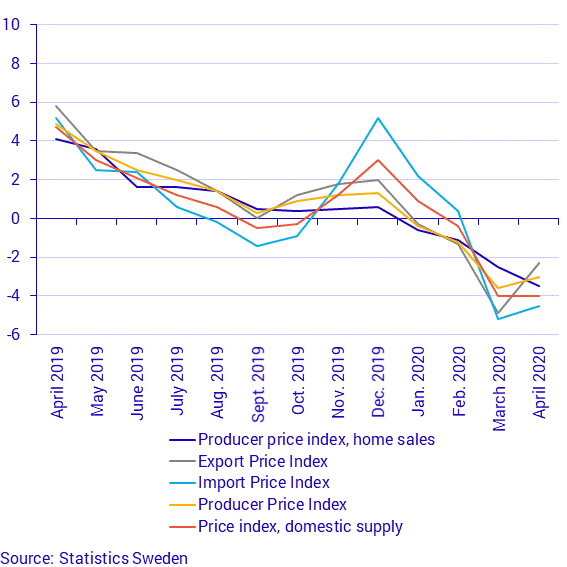
For all markets, declines were apparent on a yearly basis. The annual rate for the Producer Price Index was -3.0 percent in April. Compared with the same period a year ago, prices on energy-related products fell by 31.1 percent. At the same time, prices on consumer goods and capital goods increased by 4.2 percent and 3.8 percent respectively.
The annual rate for the Price Index for Domestic Supply was -4.0 percent. Prices on energy-related products fell compared with the same period a year ago, by 36.7 percent. Prices on consumer goods and capital goods increased by 5.9 percent and 4.5 percent respectively in the same period.
The annual rate was -4.5 percent on the import market, -2.3 percent on the export market, and -3.5 on the domestic market.
Changes in exchange rates
An appreciation or depreciation of the Swedish currency lowers or raises export and import prices in the Swedish krona. Prices at the producer and import stages are converted from foreign currencies to Swedish kronor according to the Swedish Customs’ exchange rates.
| Currency | Change, percent (monthly) |
Change, percent (yearly) |
|---|---|---|
| March 2020– April 2020 |
April 2019– April 2020 |
|
| DKK | ‑7.0 | ‑8.5 |
| EUR | ‑7.0 | ‑8.6 |
| GBP | 6.1 | 1.7 |
| NOK | 17.0 | 18.6 |
| USD | ‑5.8 | ‑12.9 |
A positive number means that the Swedish krona was strengthened against that currency.
Definitions and explanations
The Producer Price Index home sales (HMPI) measures changes in Swedish producers’ prices of goods manufactured and sold in Sweden.
The Export Price Index (EXPI) measures changes in Swedish producers’ prices of goods manufactured in Sweden and sold outside Sweden, both within and outside the EU.
The Import Price Index (IMPI) measures changes in the prices of imports of goods into Sweden.
The Producer Price Index (PPI) measures changes in the prices of Swedish producers’ total sales, obtained by combining the HMPI and the EXPI.
The Price Index for Domestic Supply (ITPI) measures changes in the prices of goods sold in Sweden, obtained by combining the HMPI and the IMPI.
Next publishing will be
Statistics for May will be published on 2020-06-26 at 09:30.
Statistical Database
More information is available in the Statistical Database
Feel free to use the facts from this statistical news but remember to state Source: Statistics Sweden.