Turnover in retail trade, November 2023
Retail sales volume decreased in November 2023
Statistical news from Statistics Sweden 2024-01-10 8.00
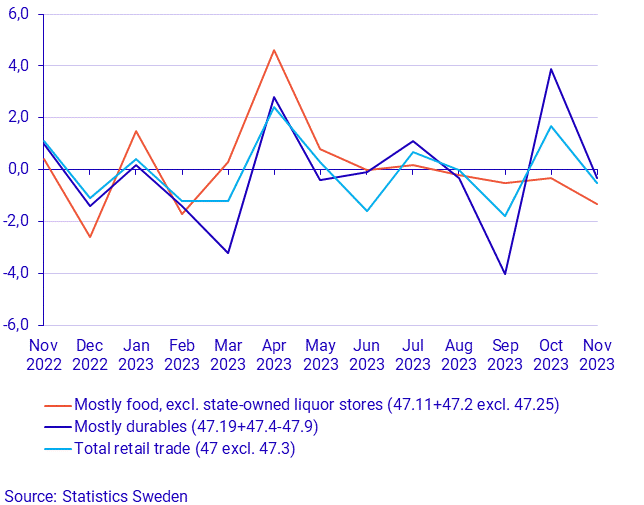
The retail sales volume decreased by 0.5 percent in November 2023 compared with October 2023. Retail sales in consumables (excluding Systembolaget, the state-owned chain of liquor stores) decreased by 1.3 percent and retail sales in durables decreased by 0.3 percent. These figures are working-day and seasonally adjusted and calculated in constant prices. Please note that for periods between January 2022 and October 2023, the statistics have been corrected. For more information, see section "Correction of the statistics".
In the last three-month period (September-November), sales volume in working-day and seasonally adjusted figures decreased by 0.6 percent compared with the previous three-month period (June-August). Retail sales in durables decreased by 1.4 percent and retail sales in consumables (excluding Systembolaget) decreased by 1.2 percent.
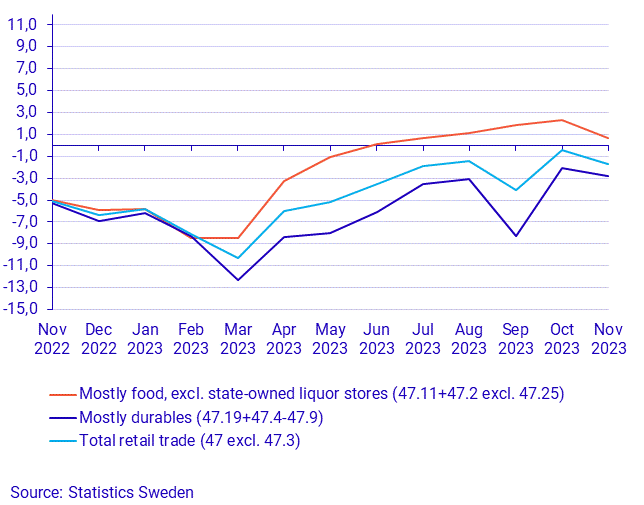
In November, the year-on-year growth rate in the volume of retail sales was negative 1.7 percent in working-day adjusted figures. Retail sales in durables decreased by 2.8 percent while retail sales in consumables (excluding Systembolaget) increased by 0.7 percent.
In constant prices and non-working-day adjusted figures, total retail trade decreased by 1.7 percent in volume compared with the corresponding period a year ago. Retail sales in durables decreased by 2.8 percent while retail sales in consumables (excluding Systembolaget) increased by 0.6 percent.
Turnover in retail trade measured in current prices increased by 3.5 percent in November 2023 compared with November 2022. Retail sales in durables increased by 1.9 percent and retail sales in consumables (excluding Systembolaget) increased by 6.5 percent.
Correction of the statistics:
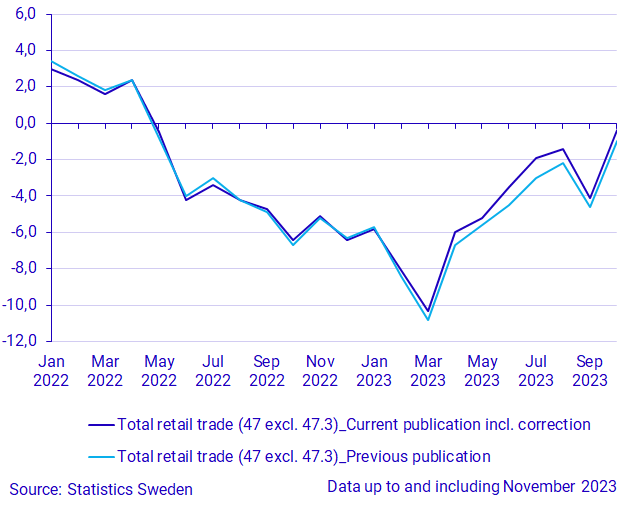
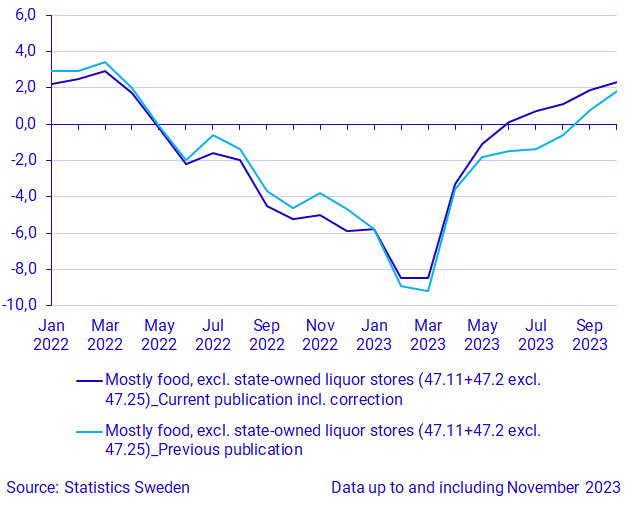
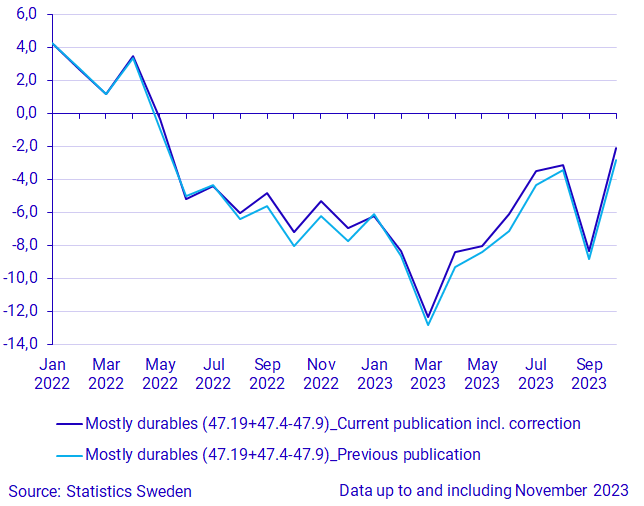
When computing statistics for reference month November 2023, problems with constant price calculations were detected. The problem is due to incorrect weights for price indices being used in calculating constant prices. Checks carried out show that the problem goes back to January 2022, which is why index series for all industries in constant prices have been corrected for all periods back to January 2022. For total retail trade (NACE 47 excl. 47.3), the largest correction is found in the reference month July 2023, where the annual development is adjusted upwards by 1.1 percentage points. In other periods, the corrections are smaller. The graphs and table below show the impact on annual development figures for total retail trade as well as retail sales in mostly food, excl. state-owned liquor stores and retail sales in mostly durables.
| Period | Total retail trade | Mostly food | Mostly durables |
|---|---|---|---|
| 2022M01 | ‑0.4 | ‑0.7 | 0.0 |
| 2022M02 | ‑0.2 | ‑0.4 | ‑0.1 |
| 2022M03 | ‑0.2 | ‑0.5 | 0.0 |
| 2022M04 | 0.0 | ‑0.3 | 0.1 |
| 2022M05 | 0.3 | ‑0.1 | 0.6 |
| 2022M06 | ‑0.2 | ‑0.2 | ‑0.2 |
| 2022M07 | ‑0.4 | ‑1.0 | ‑0.1 |
| 2022M08 | 0.0 | ‑0.6 | 0.4 |
| 2022M09 | 0.2 | ‑0.8 | 0.8 |
| 2022M10 | 0.3 | ‑0.6 | 0.8 |
| 2022M11 | 0.1 | ‑1.2 | 0.9 |
| 2022M12 | ‑0.1 | ‑1.2 | 0.8 |
| 2023M01 | ‑0.1 | 0.0 | ‑0.1 |
| 2023M02 | 0.3 | 0.4 | 0.3 |
| 2023M03 | 0.5 | 0.7 | 0.5 |
| 2023M04 | 0.7 | 0.3 | 0.9 |
| 2023M05 | 0.4 | 0.7 | 0.4 |
| 2023M06 | 1.0 | 1.6 | 1.0 |
| 2023M07 | 1.1 | 2.1 | 0.8 |
| 2023M08 | 0.8 | 1.7 | 0.3 |
| 2023M09 | 0.5 | 1.1 | 0.5 |
| 2023M10 | 0.6 | 0.5 | 0.7 |
To consider:
The tables “Retail sale index by industry NACE Rev.2. Monthly index 1991M01 - 2023M09” and “Retail trade sales, comparison to previous period. Monthly 2001M01 - 2023M09” are no longer updated as of 2023-10-27. The same information (with the exception of a few variables) is still being updated in the table “Retail sale by industry NACE Rev. 2, index 2015=100. Month”.
From reference year 2023, there have been changes to the statistical unit, kind-of-activity unit (KAU). The changes are introduced with the ambition of improving the functional statistics that describe individual activities in the economy, for example turnover in the service sector.
Under present circumstances with broad price increases on consumer goods, consumption patterns may change. Consumers may choose cheaper alternatives for goods that have become more expensive. This might lead to an underestimation of retail sales measured in fixed prices. This might mostly be a concern for retail sales in consumables, but can also be a factor within other sectors.
Definitions and explanations
Total retail trade here refers to NACE 47 excluding 47.3.
Trade in consumables (excluding Systembolaget) here refers to NACE 47.11 and 47.2. excluding 47.25.
Trade in durables here refers to NACE 47.19 and 47.4–47.9.
Revisions
from April 2015, a new method is used to calculate the final statistics. The new method mainly involves using administrative data from the Swedish Tax Agency on a quarterly basis to increase the number of companies that are surveyed. This means that final quarterly statistics are based on a total calculation for all the companies in the frame population. Administrative data is used every quarter with the aim to improve the quality of the Retail Trade Index and decrease the response burden.
Usually, the material is revised between two and four months backwards, depending on where in the quarter the reference month is located. In connection with the publication of the first and second month in a quarter, the entire previous quarter is revised. The series, corrected for working day and seasonal effects and trend estimates, is always revised from April 1991 and forward.
Information about major revisions is published on the product page: Turnover in the service sector.
Next publishing will be
Statistics concerning December 2023 will be published on 29 January 2024.
Statistical Database
More information is available in the Statistical Database
Feel free to use the facts from this statistical news but remember to state Source: Statistics Sweden.
