Exports, imports and net trade balance, September 2021, in current prices
Net trade balance at SEK 6.3 billion in September
Statistical news from Statistics Sweden 2021-10-27 9.30
In September 2021, Swedish exports of goods amounted to SEK 146.2 billion, while imports of goods amounted to SEK 139.9 billion. As a result, the net trade balance was SEK 6.3 billion.
Foreign trade in goods resulted in a net trade deficit of SEK 6.3 billion in September 2021, according to preliminary calculations. In September 2020, there was a net trade deficit of SEK 2.8 billion.
The value of exports in September 2021 was SEK 146.2 billion, while imports were valued at SEK 139.9 billion. The corresponding values in September 2020 were SEK 124.7 billion for exports and SEK 121.9 billion for imports. Exports of goods have thus increased by 17 percent in value and imports have increased by 15 percent in value compared with September 2020. The number of weekdays in September 2021 was the same as in September 2020.
Trade in goods with countries outside the EU resulted in a surplus of SEK 18.3 billion, while EU trade resulted in a deficit of SEK 12.0 billion. As from February 2020, the United Kingdom no longer forms part of the group EU Member States and is included, instead, in the group Non-EU Member States.
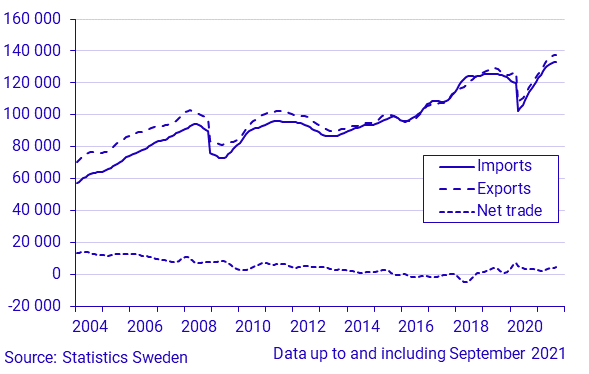
Seasonally adjusted, net trade showed a surplus of SEK 4.4 billion in September, compared with a surplus of SEK 4.4 billion in August. The corresponding figure for July was a surplus of SEK 4.2 billion.
Net trade (January - September 2021) showed a surplus of SEK 30.3 billion
During this period, the value of exports of goods increased by 12 percent and the value of imports of goods increased by 14 percent compared with the corresponding period a year ago. Exports were valued at SEK 1 180.3 billion and imports were valued at SEK 1 150.0 billion, resulting in a net trade surplus of SEK 30.3 billion for January - September 2021. The corresponding net trade balance for these months one year earlier was a surplus of SEK 44.0 billion.
| Month | Total | EU Member States[*] | Non EU Member States | ||||||||
|---|---|---|---|---|---|---|---|---|---|---|---|
| 2019 | 2020 | 2021 | 2019 | 2020 | 2021 | 2019 | 2020 | 2021 | |||
| Exports | Jan | 125.7 | 131.3 | 114.2 | 74.0 | 75.8 | 63.3 | 51.7 | 55.5 | 50.9 | |
| Febr | 122.0 | 127.7 | 123.6 | 72.2 | 66.9 | 66.1 | 49.8 | 60.8 | 57.5 | ||
| March | 133.1 | 131.1 | 143.8 | 79.2 | 66.9 | 77.9 | 53.9 | 64.2 | 65.9 | ||
| April | 128.4 | 106.3 | 131.7 | 74.6 | 52.2 | 69.8 | 53.8 | 54.1 | 61.9 | ||
| May | 136.5 | 102.3 | 133.8 | 78.8 | 53.0 | 70.7 | 57.7 | 49.3 | 63.1 | ||
| June | 122.5 | 119.6 | 144.2 | 71.4 | 60.9 | 75.9 | 51.1 | 58.7 | 68.3 | ||
| July | 123.0 | 103.8 | 127.1 | 68.2 | 52.0 | 66.6 | 54.8 | 51.8 | 60.5 | ||
| Aug | 113.6 | 103.8 | 115.7 | 68.2 | 57.3 | 64.3 | 45.4 | 46.5 | 51.4 | ||
| Sept | 128.2 | 124.7 | 146.2 | 74.1 | 66.9 | 78.8 | 54.1 | 57.8 | 67.4 | ||
| Oct | 137.0 | 128.6 | 78.6 | 67.2 | 58.4 | 61.4 | |||||
| Nov | 131.5 | 128.2 | 73.7 | 68.7 | 57.8 | 59.5 | |||||
| Dec | 116.9 | 119.7 | 65.6 | 63.1 | 51.3 | 56.6 | |||||
| Total | 1 518.4 | 1 427.1 | 1 180.3 | 878.6 | 751.0 | 633.4 | 639.8 | 676.1 | 546.9 | ||
| Imports | Jan | 124.8 | 120.3 | 109.6 | 86.8 | 84.3 | 75.2 | 38.0 | 36.0 | 34.4 | |
| Febr | 117.6 | 114.8 | 117.9 | 84.5 | 76.7 | 80.9 | 33.1 | 38.1 | 37.0 | ||
| March | 128.3 | 125.6 | 141.1 | 90.6 | 85.2 | 96.5 | 37.7 | 40.4 | 44.6 | ||
| April | 128.8 | 101.0 | 129.9 | 89.7 | 66.2 | 88.6 | 39.1 | 34.8 | 41.3 | ||
| May | 131.0 | 101.5 | 130.2 | 93.2 | 67.8 | 87.2 | 37.8 | 33.7 | 43.0 | ||
| June | 120.9 | 115.1 | 134.9 | 84.5 | 78.1 | 91.0 | 36.4 | 37.0 | 43.9 | ||
| July | 116.5 | 100.6 | 120.3 | 77.9 | 66.5 | 80.1 | 38.6 | 34.1 | 40.2 | ||
| Aug | 119.2 | 105.8 | 126.2 | 80.5 | 71.3 | 81.3 | 38.7 | 34.5 | 44.9 | ||
| Sept | 127.1 | 121.9 | 139.9 | 91.5 | 83.4 | 90.8 | 35.6 | 38.5 | 49.1 | ||
| Oct | 140.9 | 124.6 | 98.3 | 86.3 | 42.6 | 38.3 | |||||
| Nov | 128.9 | 126.8 | 92.8 | 88.1 | 36.1 | 38.7 | |||||
| Dec | 119.8 | 118.5 | 83.5 | 81.6 | 36.3 | 36.9 | |||||
| Total | 1 503.8 | 1 376.5 | 1 150.0 | 1 053.8 | 935.7 | 771.6 | 450.0 | 440.8 | 378.4 | ||
| Net Trade of Goods | Jan | 0.9 | 11.0 | 4.6 | ‑12.8 | ‑8.5 | ‑11.9 | 13.7 | 19.5 | 16.5 | |
| Febr | 4.4 | 12.9 | 5.7 | ‑12.3 | ‑9.8 | ‑14.8 | 16.7 | 22.7 | 20.5 | ||
| March | 4.8 | 5.5 | 2.7 | ‑11.4 | ‑18.3 | ‑18.6 | 16.2 | 23.8 | 21.3 | ||
| April | ‑0.4 | 5.3 | 1.8 | ‑15.1 | ‑14.0 | ‑18.8 | 14.7 | 19.3 | 20.6 | ||
| May | 5.5 | 0.8 | 3.6 | ‑14.4 | ‑14.8 | ‑16.5 | 19.9 | 15.6 | 20.1 | ||
| June | 1.6 | 4.5 | 9.3 | ‑13.1 | ‑17.2 | ‑15.1 | 14.7 | 21.7 | 24.4 | ||
| July | 6.5 | 3.2 | 6.8 | ‑9.7 | ‑14.5 | ‑13.5 | 16.2 | 17.7 | 20.3 | ||
| Aug | ‑5.6 | ‑2.0 | ‑10.5 | ‑12.3 | ‑14.0 | ‑17.0 | 6.7 | 12.0 | 6.5 | ||
| Sept | 1.1 | 2.8 | 6.3 | ‑17.4 | ‑16.5 | ‑12.0 | 18.5 | 19.3 | 18.3 | ||
| Oct | ‑3.9 | 4 | ‑19.7 | ‑19.1 | 15.8 | 23.1 | |||||
| Nov | 2.6 | 1.4 | ‑19.1 | ‑19.5 | 21.7 | 20.9 | |||||
| Dec | ‑2.9 | 1.2 | ‑17.9 | ‑18.5 | 15.0 | 19.7 | |||||
| Total | 14.6 | 50.6 | 30.3 | ‑175.2 | ‑184.7 | ‑138.2 | 189.8 | 235.3 | 168.5 | ||
*) As from February 2020, the United Kingdom no longer forms part of the group EU Member States and is included, instead, in the group Non-EU Member States.
Statistical Database
More information is available in the Statistical Database
Feel free to use the facts from this statistical news but remember to state Source: Statistics Sweden.