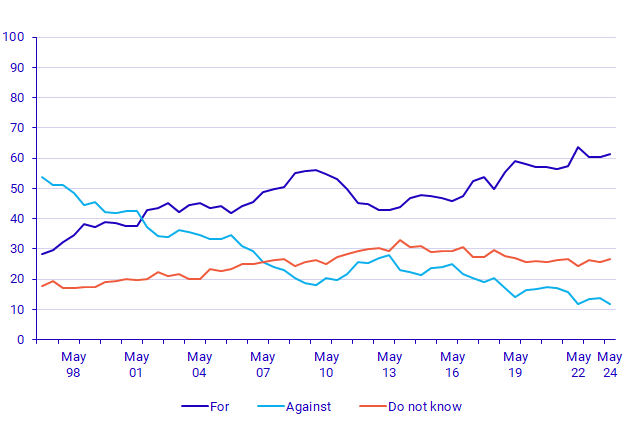
EU preferences 1996-2024
Distribution of responses in percent
May 2024. Distribution of responses in percent by sex
|
For |
Against |
Don't know |
|||||||
|---|---|---|---|---|---|---|---|---|---|
| Percent | Margin of error | Percent | Margin of error | Percent | Margin of error | Tot. % | No. resp. | ||
|
Men
|
61.8 | ±2.4 | 14.9 | ±1.8 | 23.3 | ±2.2 | 100 | 2 273 | |
|
Women
|
61.3 | ±2.3 | 8.9 | ±1.3 | 29.8 | ±2.3 | 100 | 2 154 | |
|
Total
|
61.5 | ±1.6 | 11.9 | ±1.1 | 26.6 | ±1.5 | 100 | 4 427 | |
Question: Are you principally for or against Sweden's membership in the EU or are you undecided?