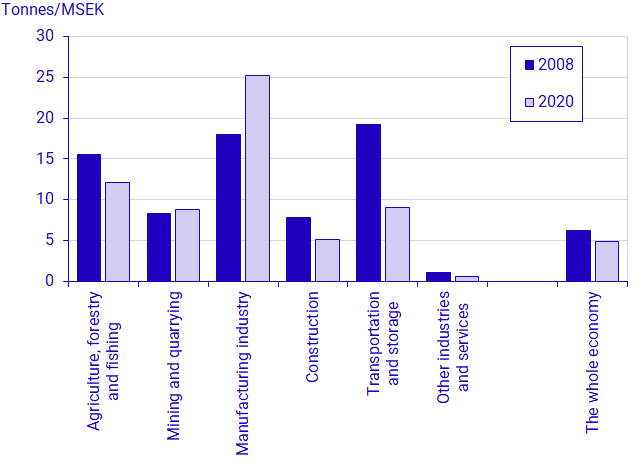
Chemical intensities, 2008 and 2020
Chemical products labelled as dangerous for health and the environment including petroleum fuels, per value added in constant 2008 prices, tonnes/MSEK

Source: Swedish Chemical Agency and Statistics Sweden
Comments
The data about use of chemical products, is here expressed as intensities. The intensities show the quantity of chemical products labelled as dangerous for health and the environment including petroleum fuels and per the value added in each industry group.
Note that big differences between the years doesn't necessarily mean that there have been a real change in volumes, but can reflect the fact that substances in a chemical product can go from being not labelled as harmful, to being labelled as harmful.
More about the results
Source
SCB
Last updated
2022-06-02