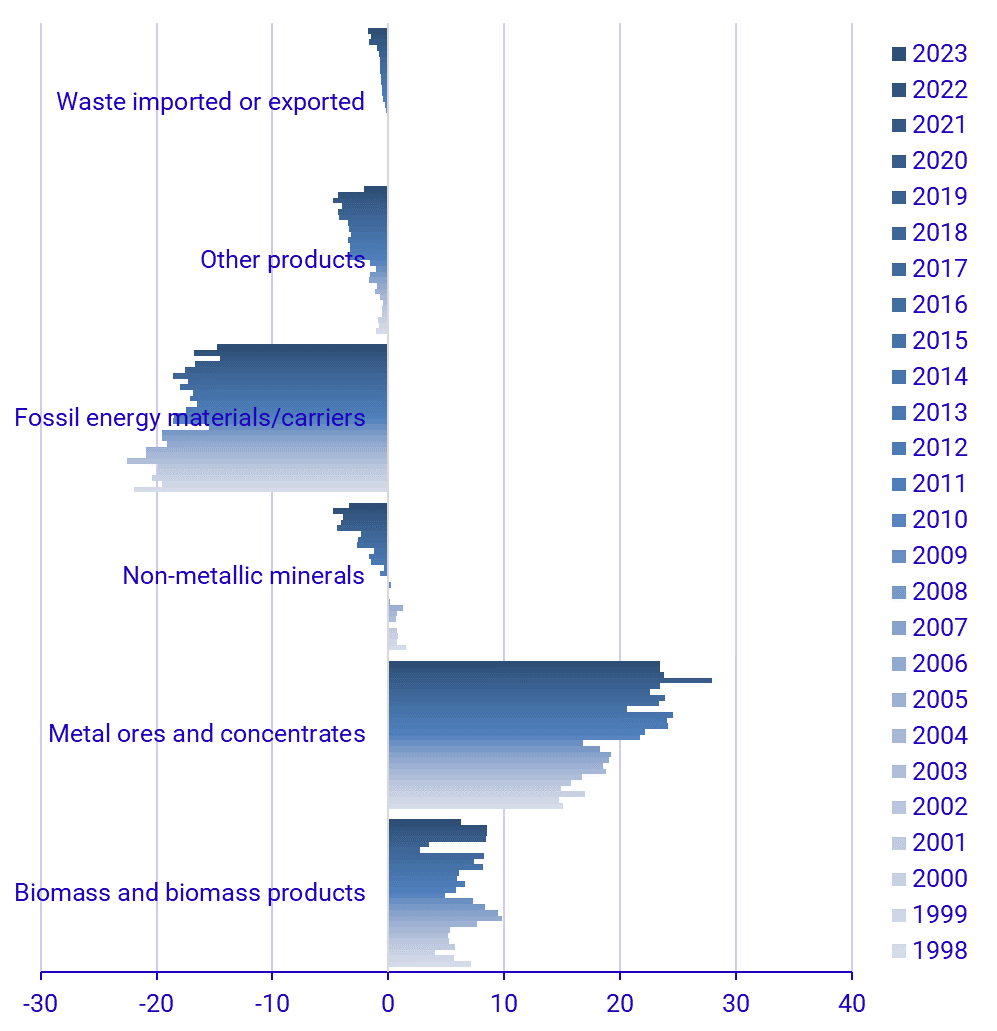
Physical trade balance per category of material, Sweden 1998-2023
Million tonnes per year

Comments
The graph illustrates the physical trade balance, exports minus imports, per category of material in various years. Note that positive values imply that there is trade surplus, i.e. that Sweden export more than we import. A trade deficit is then the opposite.