Life expectancy at age 30 by educational attainement 2000-2023


Comments
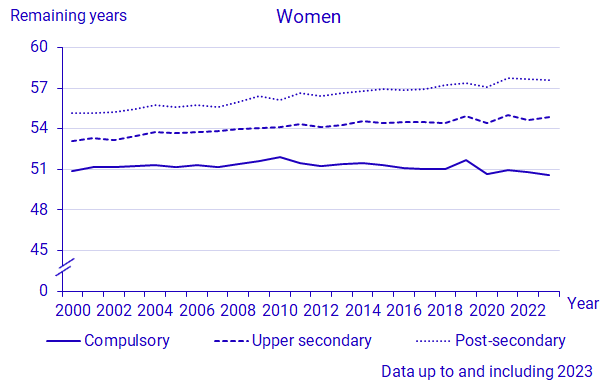
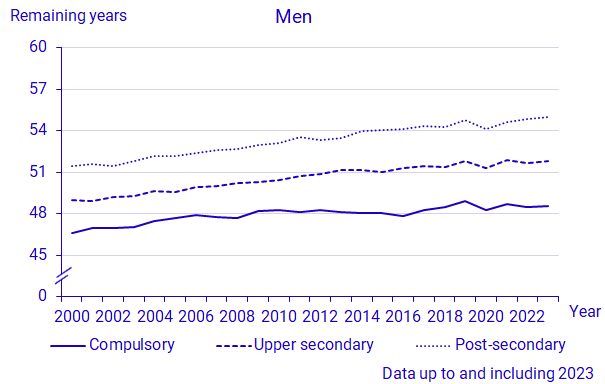
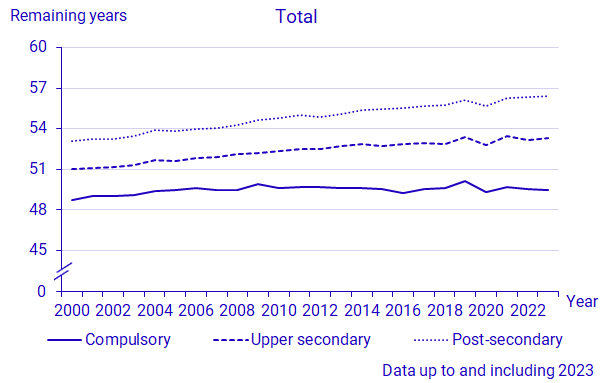
Throughout the period 2000–2023, remaining life expectancy at 30 years has been highest for the group with post-secondary education and lowest for the group with compulsory education. In 2023, remaining life expectancy was 7.1 years higher for women with post-secondary education than those with compulsory education, 57.6 years compared to 50.6 years. For men, the difference between these two groups was 6.5 years, 55 years for those with post-secondary education and 48.6 years for those with compulsory education. The difference between those with post-secondary education and those with upper secondary education was 2.8 years för women and 3.2 years för men. The group with upper secondary education had a life expectancy that was 4.3 years (for women) and 3.2 years (for men) higher than for those with compulsory education.
The number of years of remaining life expectancy at 30 years increased for all groups between 2000 and 2019. In 2020, remaining live expectancy dropped for all groups due to a high mortality from COVID-19 but recovered in 2021. Life expectancy for women with post-secondary education and women with upper secondary education was almost at the same level in 2023 as in 2021. For women with compulsory education, life expectancy decreased by 0.4 years. Among men, life expectancy for the groups with compulsory- and upper secondary education was at roughly the same level in 2023 as in 2021. But life expectancy for men with a post-secondary education increased by 0.4 years.
The trends in life expectancy for the different educational groups has varied during the entire period 2000 to 2023. The largest increase, 3.6 years, occurred among men with post-secondary education, from 51.4 years to 55 years. Among women it was those with post-secondary education who had the largest increase, 2.4 years. The only group with a lower remaining life expectancy in 2023 compared to 2000 was women with compulsory education. Their remaining life expectancy decreased by 0.3 years.
Remaining life expectancy by level of education is displayed here for persons born in Sweden. Results for foreign-born persons can be found in the Statistical database. The calculation of life expectancy is smoothed for death risks in the highest ages, 90 years and older, for 2000–2009, and 99 years and older for 2010–2011. The smoothing in 2000–2011 means that all groups of education are allotted the same death risk as women and men born in Sweden in total in the country as from the various high ages. The reason for this smoothing is that the level of education is not available for anyone born in Sweden before 1911. As from 2012, the same calculation is used as in the official statistics for women and men in total in Sweden.