Monthly indicator of household consumption, November 2020
Household consumption decreased in November
Statistical news from Statistics Sweden 2021-01-08 9.30
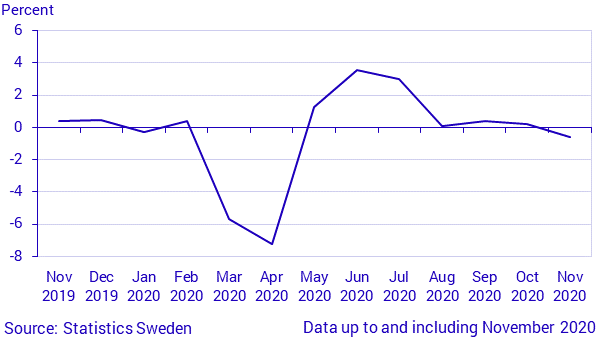
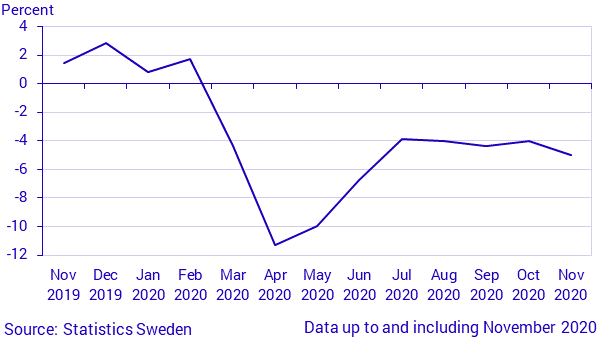
Household consumption decreased by 0.6 percent in November 2020, measured in seasonally adjusted figures, compared with October 2020. Compared with November 2019, household consumption decreased by 5.0 percent, measured in fixed prices and working day adjusted figures. In the last three-month period, consumption decreased by 4.4 percent in fixed prices and working day adjusted figures, compared with the same period a year ago.
The largest weighted negative contribution came from the sector restaurants, cafes, hotels and other accommodation services, which decreased by 38.4 percent in fixed prices compared with November a year ago.
Recreation and culture, goods and services accounted for the largest weighted positive contribution to total consumption and increased by 2.0 percent in fixed prices compared with November a year ago.
Prices increased by 0.6 percent according to the consumption deflator.
The graphs below show the seasonally adjusted monthly development and the working-day adjusted annual development in the last twelve months. The table that shows the year-on-year growth rates for total consumption and per activity has been moved to the product page under Tables and graphs. Also included on the product page are two graphs: one showing a long index series on seasonally adjusted values, and one showing a long time series on the annual growth rate in fixed prices and working-day adjusted figures.


Next publishing will be
2021-02-05 at 09:30.
Statistical Database
More information is available in the Statistical Database
Feel free to use the facts from this statistical news but remember to state Source: Statistics Sweden.
