Business Production Index, August 2017:
Production in the business sector decreased in August
Statistical news from Statistics Sweden 2017-10-09 9.30
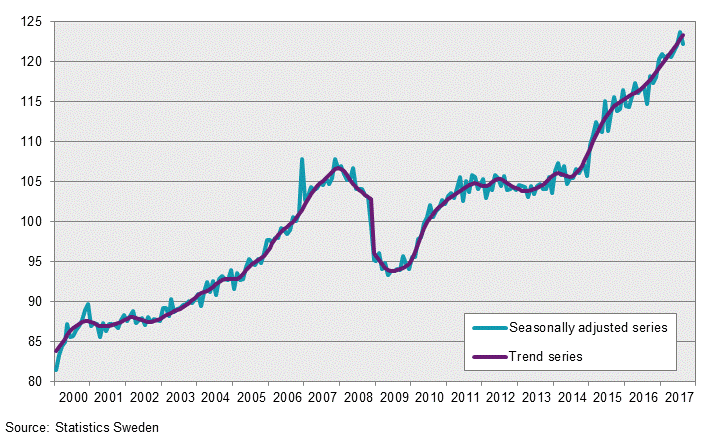
Production in the business sector decreased by 1.2 percent in seasonally adjusted figures in August compared with July. Compared with the corresponding month of the previous year, production in the business sector increased by 6.5 percent in calendar-adjusted figures.
This is the last month to present figures for Business Production Index, since this index is replaced by Production Value Index.
The decrease in monthly production was driven by the industrial sector, which decreased by 1.8 percent in August, in seasonally adjusted figures. Production in the construction sector contributed as well, with a strong decrease of 9.6 percent compared with the previous month. Service production remained unchanged in August compared with July, in seasonally adjusted figures.
In the three-month period from June to August 2017, production increased by 1.4 percent compared with the previous three-month period, March to May, in seasonally adjusted figures. The strongest development was in production in construction, with an increase of 2.4 percent. Service production increased by 1.6 percent and the industrial sector increased by 0.6 percent.
In calendar-adjusted figures, production in the business sector increased by 6.5 percent in August compared with the corresponding month in the previous year. Production in construction had the strongest yearly development, with an increase of 14.6 percent, while the service sector had the weakest development, with an increase of 5.2 percent.
Since the previous publication, the change in production in July compared with June has been revised downwards by 0.2 percentage points to an increase of 1.3 percent. The annual change in production, July compared with the corresponding month of the previous year, has not been revised and remains at an increase of 6.1 percent.

Nace rev.2 |
Business/Business group |
Monthly develop-ment | Three month develop-ment | Yearly develop-ment | Accumul-ated yearly develop-ment | Share of value added 2016 |
|---|---|---|---|---|---|---|
| Aug / July[1] | June-Aug / Mar-May[1] | Aug 2017 / Aug 2016[2] | 2017[3] | |||
B-S excl. K and O |
Business activities excluding finance and insurance |
-1.2 | 1.4 | 6.5 | 5.0 | 100 |
B-D excl. 35.2-35.3 |
Mines and quarries, manufacturing industry and electricity supply |
-1.8 | 0.6 | 7.2 | 5.2 | 26.4 |
F |
Construction sector |
-9.6 | 2.4 | 14.6 | 13.3 | 8.4 |
E, G-S excl. K and O |
Service sector including water supply and waste disposal excluding finance and insurance sector |
0.0 | 1.6 | 5.2 | 3.9 | 65.2 |
1) Calendar and seasonally adjusted figures. 2) Calendar adjusted figures. 3) Calendar adjusted figures. The period from January to the current month compared with the same period in the previous year.
Definitions and explanations
From December 2012, Statistics Sweden produces monthly statistics on production in the business sector. The statistics are compiled based on requests from users. They are an important indicator of the business cycle, as business production accounts for approximately 70 percent of the gross domestic product (GDP). These statistics should be seen as experimental until further notice.
Revisions
When the Business Production Index for a new month is published, the index for previous months is also revised. This is mainly due to new and revised information that has been received. Working day adjusted figures, seasonally adjusted figures and trend figures are always revised from January 2000 onwards.
Next publishing will be
2017-10-09 at 09:30. The publishing concerns Production Value Index which will replace Business Production Index as of this date.
Statistical Database
More information is available in the Statistical Database
Feel free to use the facts from this statistical news but remember to state Source: Statistics Sweden.
