European Parliament elections 2019, election results:
Voter turnout in the European Parliament elections increasing in Sweden
Statistical news from Statistics Sweden 2019-07-04 9.30
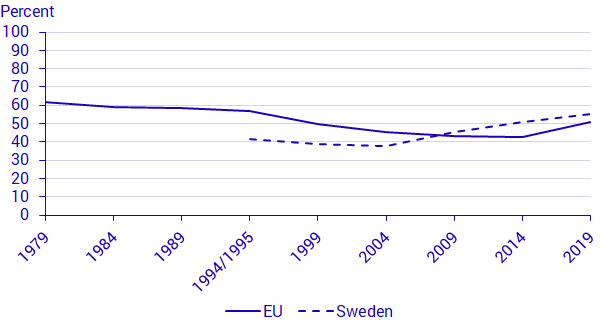
Voter turnout in the European Parliament elections was 55 percent in Sweden – increasing for the third consecutive election. The Moderate Party, the Sweden Democrats, the Centre Party and the Christian Democrats received more seats compared with 2014. The Social Democrats remained unchanged, but still received most seats.
Statistics Sweden now published the Swedish results of the 2019 European Parliament elections. The election results include statistics on the number of persons entitled to vote, voter turnout, the number of votes submitted, including invalid and valid votes by political party, and the distribution of seats. Statistics Sweden has statistics on European Parliament elections from 1995 and forward.
In the elections on 26 May 2019, just under 4.2 million persons voted in the Swedish European Parliament elections out of 7.6 million persons entitled to vote, which corresponds to a 55 percent voter turnout. In the last three European Parliament elections, Swedish voter turnout has been higher than the EU average. However, despite increasing voter turnout, it remains considerably lower than in the 2018 parliamentary elections, when voter turnout was 87 percent.

Source: Statistics Sweden’s Election statistics and the European Parliament (https://valresultat.eu, 2019-06-26)
Different distribution of votes, but the same political parties as in the parliamentary election gain seats
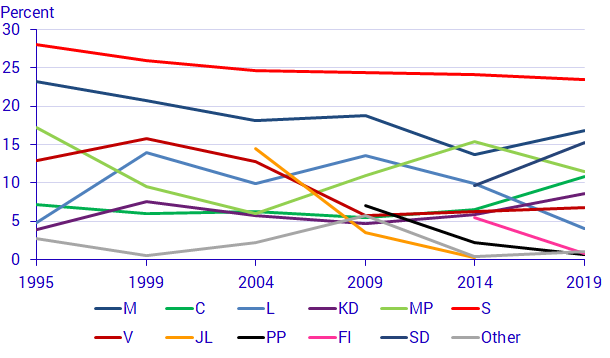
Five political parties gained a larger share of votes compared with the 2014 European Parliamentary elections: the Sweden Democrats, the Centre Party, the Moderate Party, the Christian Democrats and the Left Party. The Liberal Party, the Feminist Initiative Party, the Green Party, the Pirate Party and the Social Democrats lost votes.

C=Centre Party, L=Liberal Party, M=Moderate Party, KD=Christian Democrats, S=Social Democrats, V=Left Party, MP=Green Party, SD=Sweden Democrats, FI=Feministiskt initiativ, PP=The Pirate Party, JL=Junilistan.
Comments: Before the 2014 election, the Sweden Democrats were reported together with "other" political parties.
Sweden holds 20 out of 751 seats
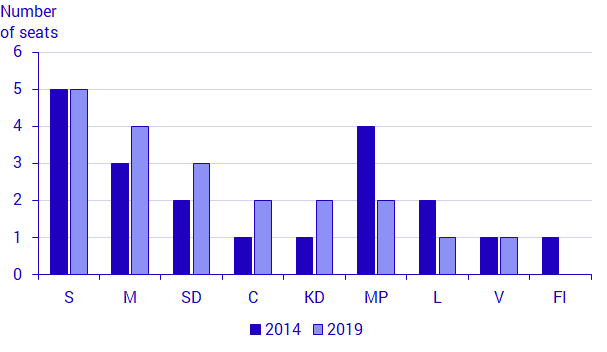
Sweden has had 20 seats in the European Parliament since 2014. The Social Democrats holds five of these seats, which is unchanged from 2014. The Moderate Party, the Sweden Democrats, the Centre Party and the Christian Democrats all increased by one seat each compared with 2014. The Green Party and the Liberal Party hold half as many seats as in 2014. The Left Party holds the same number of seats as five years ago.

Definitions and explanations
The first European Parliament elections were held in 1979. Sweden joined the European Union following a referendum in 1994, and the first Swedish elections to the European Parliament were held in 1995. Sweden has subsequently participated in European Parliament elections in 1999, 2004, 2009, 2014 and 2019.
Statistical Database
More information is available in the Statistical Database
Feel free to use the facts from this statistical news but remember to state Source: Statistics Sweden.
