The Swedish Occupational Register with statistics 2016:
Even distribution between men and women among managers on the whole, but uneven distribution in manager occupations
Statistical news from Statistics Sweden 2018-03-07 9.30
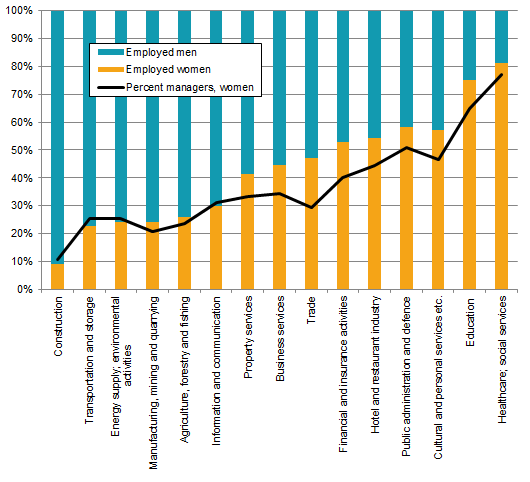
In total, among managers (not including politicians, senior officials and CEOs), 60 percent were men and 40 percent were women in 2016. Women managers were mainly present in occupational groups dominated by women, while men were present in occupational groups dominated by men, such as construction and manufacturing.
In all except three sectors, the distribution by sex is different among managers than among employees, with a higher percentage of men among managers than among employees (1).
The largest percentage of women managers is present in education and in health and medical care, specifically in the occupations Pre-school managers and Managers in elderly care, in which 92 percent and 86 percent are women, respectively.
Production managers in construction and mining was the manager position with the largest percentage of men, 92 percent. Only 8 percent of managers in this area were women.
Manager functions in which the sex distribution was balanced included Finance managers, Information and communication managers, Public relations managers and Restaurant managers.
(1) All manager groups are included in the comparison, that is, also senior officials and politicians (such as ambassadors, municipal managers, Members of the Riksdag and State Secretaries), and senior officials in non-profit organisations (such as chairs and secretary generals). Occupational group 1.
Distribution varies among blue collar workers and white collar workers, depending on region of birth
‘Blue collar workers’ refers to those in occupational group 5, 6, 7, 8, or 9, with the exception of occupations 5111, 5113, and 5242, which are classified as white collar workers. ‘White collar worker’ refers to those in occupational group 0, 1, 2, 3, or 4, with the exception of occupations 3451, 4211, 4321, 4322, 4323 and 4420, which are classified as blue collar workers.
Table 1a shows the number and distribution of blue collar workers and white collar workers, by region of birth among employed men. Among employed men overall, 53 percent were blue collar workers and 47 percent were white collar workers. The distribution was approximately the same among men born in Sweden and those born in the Nordic region. Men born in Oceania accounted for the highest percentage, 63 percent, white collar workers. Men born in Africa had the lowest percentage, 22 percent, of white collar workers, followed by men born in Asia.
| Region of birth 1) | Blue collar workers, number | White collar workers, number | Blue collar workers, percent | White collar workers, percent |
|---|---|---|---|---|
|
Sweden
|
894 410 | 866 640 | 51 | 49 |
|
The Nordic countries, excluding Sweden
|
17 700 | 16 150 | 52 | 48 |
|
Europe excluding the Nordic countries
|
85 040 | 46 820 | 64 | 36 |
|
North and Central America
|
3 670 | 4 860 | 43 | 57 |
|
Oceania
|
660 | 1 140 | 37 | 63 |
|
Asia
|
72 880 | 37 800 | 66 | 34 |
|
South America
|
12 120 | 6 530 | 65 | 35 |
|
Africa
|
28 310 | 8 030 | 78 | 22 |
|
Unknown country of birth
|
140 | 50 | 72 | 28 |
|
Total, foreign born Men
|
220 520 | 121 390 | 64 | 36 |
|
Total, Men
|
1 114 930 | 988 020 | 53 | 47 |
1) Total number among those with occupation data listed according to the Swedish Standard Classification of Occupations (SSYK 2012) at the four-digit level. The figures are rounded to the nearest 10.
Table 1b shows the number and distribution of blue collar workers and white collar workers by region of birth among employed women. The largest difference between the distribution between men and women among blue collar workers and white collar workers was that there was a higher percentage of white collar workers among women than among men. Among women, the percentage of white collar workers was 56 percent, while among men it was nine percentage points lower, 47 percent.
Among employed women, the difference in the percentage of blue collar workers and white collar workers was also larger depending on country of birth than among men. Women born in Oceania have, as among men, the largest percentage of white collar workers, 68 percent, followed by women born in North and Central America and the Nordic countries, excluding Sweden, with 62 percent and 60 percent, respectively. Among Swedish born women, 59 percent were white collar workers. Women born in Africa had the lowest percentage of white collar workers, 20 percent, followed by women born in Asia, 38 percent.
| Region of birth 1) | Blue collar workers, number | White collar workers, number | Blue collar workers, percent | White collar workers, percent |
|---|---|---|---|---|
|
Sweden
|
718 740 | 1 018 660 | 41 | 59 |
|
The Nordic countries, excluding Sweden
|
17 940 | 26 410 | 40 | 60 |
|
Europe excluding the Nordic countries
|
67 680 | 56 460 | 55 | 45 |
|
North and Central America
|
2 860 | 4 690 | 38 | 62 |
|
Oceania
|
250 | 540 | 32 | 68 |
|
Asia
|
68 280 | 41 000 | 62 | 38 |
|
South America
|
11 610 | 7 630 | 60 | 40 |
|
Africa
|
22 450 | 5 670 | 80 | 20 |
|
Unknown country of birth
|
80 | 50 | 60 | 40 |
|
Total, foreign born Women
|
191 150 | 142 460 | 57 | 43 |
|
Total, Women
|
909 890 | 1 161 120 | 44 | 56 |
1) According to the Swedish Standard Classification of Occupations (SSYK 2012) at the four-digit level. The figures are rounded to the nearest 10, and thus the shares do not always add up to 100. Refers to occupations with at least 100 people from temporary employment agencies. Code 78200 according to SNI2007
Occupations with employees in temporary employment agencies
Assemblers not elsewhere classified, the occupation with the largest percentage of employed by temporary employment agencies
Among Assemblers not elsewhere classified, 35 percent were employed by a temporary employment agency, which makes it the occupation with the largest percentage of temporary staff. It is followed by Cabin crew and Fork-lift drivers with 17 percent and 15 percent, respectively.
The distribution between men and women in the occupations with large percentages of temporary employment was uneven, both overall in the occupations and among the temporary employees. Among Aircraft pilots and related associate professionals, 93 percent were men, while 94 percent among pilots from temporary employment agencies were men. The only occupation in which distribution among men and women was even in both cases was Customer service information clerks, with 40 percent men and 60 percent women in the occupation in total. The distribution among customer service information clerks from temporary employment agencies was more even more balanced, with 44 percent men and 56 percent women.
Pre-press technicians was an occupation that stood out due to the large gap in distribution between men and women in the occupation in total and employees from temporary employment agencies. There were 60 percent men and 40 percent women in the occupation in total. Among employees from temporary employment agencies, there were 91 percent men and 9 percent women instead.
| Sex distribution, occupation | Sex distribution, temporary employment agencies | ||||||
|---|---|---|---|---|---|---|---|
| Occupation 1) | Total number | Men, percent | Women, percent | Temporary employment agencies, percent | Men, percent | Women, percent | |
|
Cabin crew
|
9 260 | 75 | 25 | 35 | 73 | 27 | |
|
Fork-lift drivers
|
2 310 | 20 | 80 | 17 | 21 | 79 | |
|
Back office-staff
|
11 840 | 87 | 13 | 15 | 83 | 17 | |
|
Warehouse and terminal Staff
|
2 080 | 37 | 63 | 14 | 39 | 61 | |
|
Aircraft pilots and related associate professionals
|
79 380 | 79 | 21 | 12 | 79 | 21 | |
|
Customer Service Information Clerks
|
1 590 | 93 | 7 | 11 | 94 | 6 | |
|
Pre-press technicians
|
25 640 | 40 | 60 | 11 | 44 | 56 | |
|
Machine operators not elsewhere classified, stationary plant and
|
1 800 | 60 | 40 | 10 | 91 | 9 | |
|
Process control technicians not elsewhere classified
|
3 340 | 82 | 18 | 9 | 79 | 21 | |
|
Ships' deck officers
|
2 640 | 85 | 15 | 7 | 76 | 24 | |
|
Ground personnel, movers and stockers
|
1 450 | 94 | 6 | 7 | 97 | 3 | |
|
Machine operator, cement, stone and other mineral products
|
5 530 | 91 | 9 | 7 | 79 | 21 | |
|
Personnel and human resources specialist
|
1 780 | 96 | 4 | 7 | 92 | 8 | |
|
Telephonist-switchboard operators
|
18 130 | 23 | 77 | 7 | 24 | 76 | |
|
|
5 530 | 29 | 71 | 7 | 38 | 62 | |
1) According to the Swedish Standard Classification of Occupations (SSYK 2012) at the four-digit level. The figures are rounded to the nearest 10, and thus the shares do not always add up to 100. Refers to occupations with at least 100 people from temporary employment agencies. Code 78200 according to SNI2007
Definitions and explanations
The information refers to employees aged 16-64 who are classified as gainfully employed according to the definition in the register-based labour market statistics (RAMS). Classification of gainfully employed persons is based mainly on statements of earnings and tax declaration information from the Swedish Tax Agency. For classification as gainfully employed, the person must be registered in the population records on 31 December and have an income that exceeds an estimated limit or conduct active business operations. Even those who were temporarily absent during the measurement period, for instance due to sickness or parental leave, are included in the frame. The term employee also refers to self-employed persons who run their operations as a limited company.
The occupations follow the classifications used in the Swedish Standard Classification of Occupations (SSYK 2012)
Publication
A more detailed report on this survey is published in the Statistical Report:
Next publishing will be
The next press release in this series will be published in March 2019.
Statistical Database
More information is available in the Statistical Database
Feel free to use the facts from this statistical news but remember to state Source: Statistics Sweden.