Demographic Analysis (DEMOG) Demographic analysis: Life expectancy and economic development in Europe. 1995—1996 and 2021—2022
Lowest life expectancy in countries with lowest GDP per capita
Statistical news from Statistics Sweden 2024-10-03 8.00
A new report by Statistics Sweden describes the association between life expectancy and GDP per capita in European countries in the period 1995—1996 and 2021—2022. In general, life expectancy is lowest among countries with the lowest GDP per capita.
This report analyzes life expectancy at birth, life expectancy at age 65 as well as infant mortality rate by GDP per capita and includes the EU and EFTA countries in the period 1995—1996 and 2021—2022.
Association between life expectancy and GDP per capita
In general, life expectancy at birth as well as the remaining life expectancy at age 65 is lowest among countries with the lowest GDP per capita. This applies to both women and men in both study periods. These countries are mainly countries in Eastern Europe.
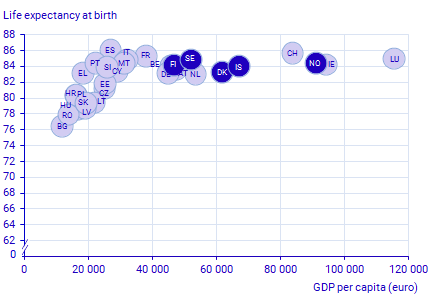
In the period 1995—1996, life expectancy at birth for women was highest in France and lowest in Romania. Life expectancy at birth for men was highest in Sweden and lowest in Estonia. In the period 2021—2022, Spain had the highest life expectancy for women and Bulgaria had the lowest. Life expectancy for men was highest in Switzerland and lowest in Latvia.
An association between GDP per capita and life expectancy at birth is seen in both periods. Among countries with lower GDP per capita, the association is positive. The higher GDP per capita in a country, the higher the life expectancy is. Among countries with higher GDP per capita, no such association is visible. These patterns can be also found when we look at remaining life expectancy at age 65.
Lowest infant mortality rate in Finland, Sweden and Norway
Infant mortality rate is highest in countries with lowest GDP per capita in both periods. Among countries with lower GDP per capita, the infant mortality rate decreases with the rise of GDP per capita. Compared with the mid of the 1990s, the infant mortality rate has decreased among all observed countries in the period 2021—2022, especially among countries with lower GDP per capita. Finland, Sweden and Norway have had the lowest infant mortality rate in both periods.
Women
Men
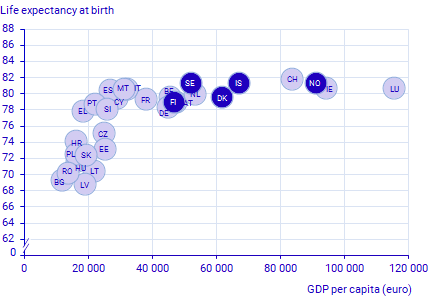
Source: Eurostat. Life expectancy for Liechtenstein not shown due to small population size.
Definitions and explanations
Average remaining life expectancy is normally referred to as “life expectancy”. This is an index that described mortality in all ages for a year or a specific period. Mortality is shown in a life table and the average number of years remaining is calculated for all ages. In this report, life expectancy at birth and the remaining life expectancy at age 65 are analyzed.
Infant mortality rate is the number of deaths of children under one year of age per 1 000 live births.
Gross domestic product, GDP is a sum of the value of all goods and services produced in a country. GDP is used as a measure to describe economic growth in a country. When international comparisons are made, the population size of the countries is often taken into account. By dividing GDP by the total population of a country, we get GDP per capita, a widely documented indicator of how rich a country is.
Data used for analysis, life expectancy, infant mortality rate and GDP per capita come from Eurostat. Life expectancy in France for year 1995 and 1996 come from OECD. The country codes used in the report come from Eurostat Glossary:Country codes - Statistics Explained (europa.eu). Explanations can also be seen in the report.
Publication
Feel free to use the facts from this statistical news but remember to state Source: Statistics Sweden.