Exports and imports of goods, quarter 2 2024/January-June 2024, in current prices and in constant prices
Exports of goods increased in the second quarter
Statistical news from Statistics Sweden 2024-08-28 8.00
In the second quarter 2024, exports of goods increased by 4 percent in value and by 2 percent in volume compared with the same period a year ago. At the same time, imports of goods fell by 1 percent in value and by 2 percent in volume.
– In the first six months of 2024, imports from the United Kingdom increased by 12 percent which amounted to about SEK 4 billion. Imports of crude petroleum oils accounted for the largest increase, says Ari Mansikkaviita, statistician at Statistics Sweden.
Summary
- In the second quarter of 2024, Swedish exports of goods increased by 4 percent in value (in current prices), and in terms of volume (in constant prices) they rose by 2 percent, compared with the same period a year ago. Imports of goods decreased by 1 percent in value, and in terms of volume they fell by 2 percent.
- Compared with the previous quarter, Swedish exports of goods increased by 4 percent in value and by 2 percent in volume. Imports of goods rose by 5 percent in value and by 3 percent in volume.
- In the period January–June 2024, the value of Swedish exports of goods amounted to SEK 1 056 billion, a decrease of 1 percent compared with the same period a year ago. At the same time, the value of imports of goods decreased by 3 percent and amounted to SEK 1 003 billion.
- In the period January–June 2024, exports of goods decreased by 1 percent and imports of goods decreased by 2 percent in volume.
- Net trade shows a surplus of SEK 53 billion in the period January–June 2024. In the same period in 2023, there was a net trade surplus of SEK 30 billion.
Detailed information about the second quarter 2024 (in current prices and in constant prices)
Exports of minerals increased by 11 percent in value and by 10 percent in volume
Exports of machinery and transport equipment increased by 1 percent in value, while they decreased by 2 percent in volume. Exports of wood and paper products rose by 3 percent in value, and by 7 percent in volume. Exports of minerals increased by 11 percent in value, and by 10 percent in volume. Exports of mineral fuels and electric current increased by 5 percent both in value and in volume. Within the other products area, exports of food/beverages/tobacco increased by 1 percent in value, while they decreased by 3 percent in volume.
| Exports | ||||||||
|---|---|---|---|---|---|---|---|---|
| Value (current prices) | Value (current prices) | Volume (value in constant prices) | Value (current prices) | Volume (value in constant prices) | ||||
| Share in % | Change in % | Change in % | Change in % | Change in % | ||||
| Commodity group according to SITC | January-June 2024 | January-June 2023 | January-June 2024 | Q1-2 2024/Q1-2 2023 | Q1-2 2024/Q1-2 2023 | Q2 2024/Q2 2023 | Q2 2024/Q2 2023 | |
| Total | 1 056 388 | 1 062 795 | 100.0 | ‑1 | ‑1 | 4 | 2 | |
| Wood and paper products | 93 865 | 97 145 | 8.9 | ‑3 | 5 | 3 | 7 | |
| Wood | 22 353 | 23 255 | 2.1 | ‑4 | ‑6 | 4 | 0 | |
| Pulp and waste paper | 15 042 | 17 236 | 1.4 | ‑13 | ‑7 | ‑8 | ‑12 | |
| Paper, paper products | 52 280 | 52 442 | 4.9 | 0 | 15 | 6 | 17 | |
| Minerals | 106 295 | 111 396 | 10.1 | ‑5 | ‑3 | 11 | 10 | |
| Iron ore and concentrates | 12 132 | 17 362 | 1.1 | ‑30 | ‑31 | 10 | 10 | |
| Iron and steel | 41 942 | 49 216 | 4.0 | ‑15 | ‑8 | ‑10 | ‑3 | |
| Non-ferrous metals | 30 253 | 23 134 | 2.9 | 31 | 29 | 54 | 40 | |
| Chemicals, rubber products | 162 872 | 160 794 | 15.4 | 1 | 1 | 7 | 5 | |
| Organic/inorganic chemicals | 14 661 | 16 682 | 1.4 | ‑12 | ‑3 | 6 | 11 | |
| Pharmaceutical products | 81 662 | 78 357 | 7.7 | 4 | 1 | 9 | 3 | |
| Plastics | 26 190 | 24 614 | 2.5 | 6 | 10 | 14 | 14 | |
| Mineral fuels, electric current | 79 585 | 82 992 | 7.5 | ‑4 | ‑1 | 5 | 5 | |
| Petroleum products | 70 605 | 65 939 | 6.7 | 7 | 6 | 20 | 15 | |
| Machinery, transport equipment | 478 261 | 472 183 | 45.3 | 1 | ‑1 | 1 | ‑2 | |
| Manufactures of metals | 26 152 | 26 197 | 2.5 | 0 | ‑1 | 3 | 1 | |
| Industrial machinery | 154 967 | 155 400 | 14.7 | 0 | ‑5 | 0 | ‑4 | |
| Electronics, telecommunication | 104 941 | 101 916 | 9.9 | 3 | 3 | 7 | 8 | |
| Road vehicles | 163 414 | 159 869 | 15.5 | 2 | ‑1 | ‑2 | ‑5 | |
| Passenger cars | 89 726 | 84 457 | 8.5 | 6 | 4 | 4 | 1 | |
| Lorries, trucks[1] | 24 805 | 26 086 | 2.3 | ‑5 | ‑13 | ‑16 | ‑22 | |
| Parts, accessories | 38 314 | 37 840 | 3.6 | 1 | ‑1 | ‑1 | ‑3 | |
| Other transport equipment | 5 473 | 6 133 | 0.5 | ‑11 | ‑11 | ‑18 | ‑18 | |
| Instruments, photo/optical products | 23 314 | 22 668 | 2.2 | 3 | ‑1 | 6 | 1 | |
| Other products | 135 509 | 138 286 | 12.8 | ‑2 | ‑4 | 1 | ‑1 | |
| Food, beverages, tobacco | 67 306 | 68 614 | 6.4 | ‑2 | ‑4 | 1 | ‑3 | |
| Textiles, clothing, footwear | 25 605 | 26 231 | 2.4 | ‑2 | ‑5 | 5 | 3 | |
| Furniture | 11 507 | 11 963 | 1.1 | ‑4 | ‑5 | 2 | 2 | |
Imports of passenger cars decreased by 24 percent in value and by 25 in volume
Imports of machinery and transport equipment decreased by 3 percent in value, and by 5 percent in volume. Within this product area imports of passenger cars decreased by 24 in value and by 25 in volume. Imports of wood and paper products rose by 7 percent in value, and by 9 percent in volume. Imports of minerals increased by 5 percent in value, and by 7 percent in volume. Imports of mineral fuels and electric current fell by 4 percent in value, and by 8 percent in volume. Within the other products area, imports of food/beverages/tobacco increased by 1 percent in value, and by 2 percent in volume.
| Imports | ||||||||
|---|---|---|---|---|---|---|---|---|
| Value (current prices) | Value (current prices) | Volume (value in constant prices) | Value (current prices) | Volume (value in constant prices) | ||||
| Share in % | Change in % | Change in % | Change in % | Change in % | ||||
| Commodity group according to SITC | January-June 2024 | January-June 2023 | January-June 2024 | Q1-2 2024/Q1-2 2023 | Q1-2 2024/Q1-2 2023 | Q2 2024/Q2 2023 | Q2 2024/Q2 2023 | |
| Total | 1 003 299 | 1 032 529 | 100.0 | ‑3 | ‑2 | ‑1 | ‑2 | |
| Wood and paper products | 27 991 | 27 951 | 2.8 | 0 | 8 | 7 | 9 | |
| Minerals | 82 805 | 83 638 | 8.3 | ‑1 | 4 | 5 | 7 | |
| Iron and steel | 29 628 | 35 642 | 3.0 | ‑17 | ‑6 | ‑13 | ‑1 | |
| Non-ferrous metals | 23 721 | 17 909 | 2.4 | 32 | 40 | 45 | 42 | |
| Metalliferous ores, metal scrap | 15 312 | 14 760 | 1.5 | 4 | ‑1 | 12 | ‑4 | |
| Chemicals, rubber products | 134 035 | 136 285 | 13.4 | ‑2 | 0 | 4 | 3 | |
| Organic/inorganic chemicals | 28 360 | 33 105 | 2.8 | ‑14 | ‑15 | ‑7 | ‑11 | |
| Pharmaceutical products | 40 146 | 35 545 | 4.0 | 13 | 14 | 18 | 19 | |
| Plastics | 22 522 | 23 388 | 2.2 | ‑4 | 1 | 2 | 4 | |
| Crude rubber, rubber products | 10 833 | 11 362 | 1.1 | ‑5 | ‑4 | ‑1 | ‑2 | |
| Mineral fuels, electric current | 105 760 | 112 543 | 10.5 | ‑6 | ‑6 | ‑4 | ‑8 | |
| Crude petroleum oils | 64 744 | 57 672 | 6.5 | 12 | 4 | 15 | 3 | |
| Petroleum products | 31 810 | 41 989 | 3.2 | ‑24 | ‑21 | ‑21 | ‑21 | |
| Machinery, transport equipment | 442 943 | 458 088 | 44.1 | ‑3 | ‑4 | ‑3 | ‑5 | |
| Manufactures of metals | 31 259 | 33 085 | 3.1 | ‑6 | ‑3 | 0 | 3 | |
| Industrial machinery | 108 920 | 111 999 | 10.9 | ‑3 | ‑7 | ‑1 | ‑6 | |
| Electronics, telecommunication | 160 230 | 157 704 | 16.0 | 2 | 4 | 1 | 3 | |
| Road vehicles | 107 655 | 122 454 | 10.7 | ‑12 | ‑14 | ‑17 | ‑19 | |
| Passenger cars | 51 693 | 62 236 | 5.2 | ‑17 | ‑18 | ‑24 | ‑25 | |
| Parts and accessories | 36 727 | 37 316 | 3.7 | ‑2 | ‑4 | 1 | ‑2 | |
| Other transport equipment | 9 787 | 7 691 | 1.0 | 27 | 25 | 44 | 40 | |
| Instruments, photo/optical equip | 25 091 | 25 155 | 2.5 | 0 | ‑5 | 0 | ‑6 | |
| Other products | 209 766 | 214 024 | 20.9 | ‑2 | ‑2 | 1 | 0 | |
| Food, beverages, tobacco | 112 090 | 112 372 | 11.2 | 0 | 1 | 1 | 2 | |
| Textiles, clothing, footwear | 44 061 | 45 504 | 4.4 | ‑3 | ‑3 | 2 | 0 | |
| Furniture | 13 186 | 13 815 | 1.3 | ‑5 | ‑7 | 1 | ‑3 | |
Value and volume trends
The value index and the volume index describe nominal and real value trends over time. The real value trends describe trends in which price changes have been removed. The indices are chain indices with base year 2015=100.
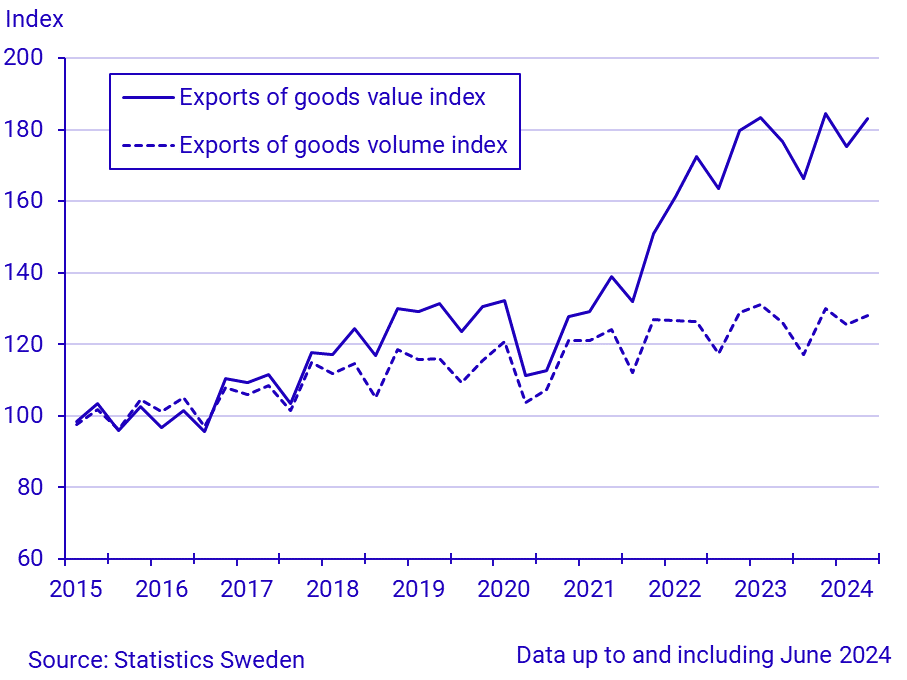
The value index and the volume index for exports of goods increased in the second quarter compared to the first quarter. The value index and the volume index are higher compared to the same period last year.
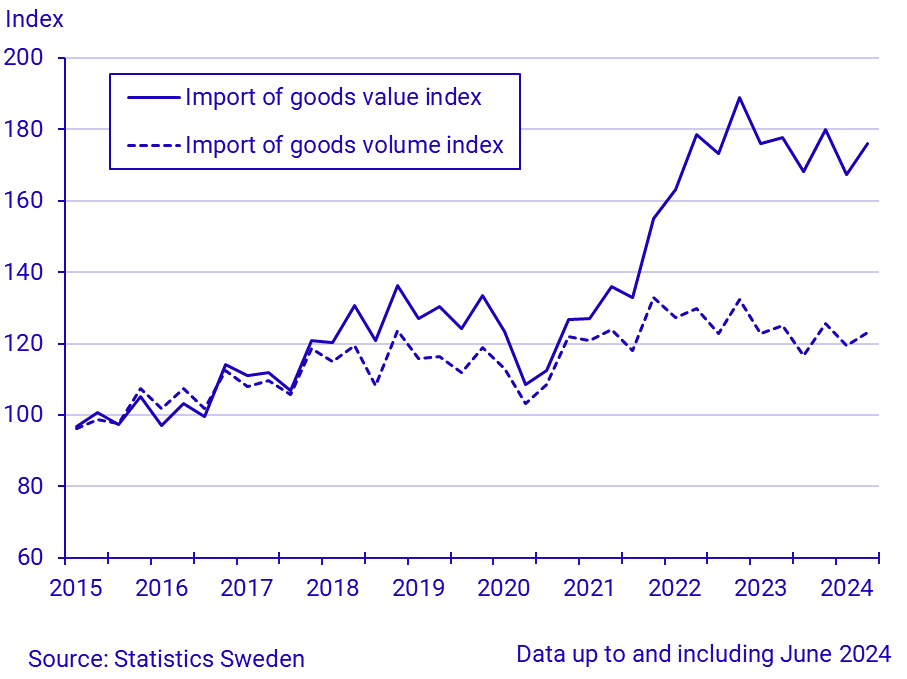
The value index and the volume index for imports of goods increased in the second quarter compared to the first quarter but are lower compared to the same period last year.
Detailed information about January–June 2024 (current prices)
Imports of goods from the United Kingdom rose by 12 percent
Both Sweden’s exports of goods to and imports of goods from EU27 decreased by 3 percent compared with the same period a year ago. Exports to euro countries fell by 3 percent and imports from there by 4 percent. Among the EU countries, exports to Germany and Denmark decreased by 8 percent while they remained the same to Finland. Imports from Germany decreased by 5 percent, from Denmark by 1 percent while they increased by 2 percent from Finland.
Exports to other European countries increased by 1 percent, while imports from there decreased by 2 percent. Exports to the United Kingdom fell by 4 percent, while imports from there rose by 12 percent. In the period, imports of crude petroleum oils accounted for the largest increase from the United Kingdom. Exports to Norway increased by 4 percent, while imports from there fell by 6 percent. Exports to Russia fell by 10 percent, while imports from there rose by 110 percent. In the period, imports of metalliferous ores/metal scrap accounted for the largest increase in percentage, but in terms of value the increase was very small.
Exports to Asia rose by 4 percent, while imports from there fell by 4 percent. Exports to China increased by 13 percent, while imports from there decreased by 3 percent. In the period, exports of pharmaceutical products accounted for the largest increase to China.
Exports to the United States decreased by 1 percent, and imports from there by 4 percent.
| Exports | Imports | ||||||||
|---|---|---|---|---|---|---|---|---|---|
| Value (current prices) | Value (current prices) | ||||||||
| Region | January-June | Share in % | Change in % | January-June | Share in % | Change in % | |||
| 2024 | 2023 | 2024 | 2024/2023 | 2024 | 2023 | 2024 | 2024/2023 | ||
| Total | 1 056 388 | 1 062 795 | 100.0 | ‑1 | 1 003 299 | 1 032 529 | 100.0 | ‑3 | |
| Europe | 766 676 | 782 225 | 72.6 | ‑2 | 838 832 | 864 234 | 83.6 | ‑3 | |
| EU27_2020 | 574 308 | 591 876 | 54.4 | ‑3 | 673 145 | 694 494 | 67.1 | ‑3 | |
| EMU-20 | 441 271 | 453 607 | 41.8 | ‑3 | 527 220 | 547 519 | 52.5 | ‑4 | |
| Other European countries | 192 368 | 190 349 | 18.2 | 1 | 165 687 | 169 740 | 16.5 | ‑2 | |
| Africa | 20 931 | 18 701 | 2.0 | 12 | 11 192 | 11 348 | 1.1 | ‑1 | |
| North Africa | 10 856 | 8 452 | 1.0 | 28 | 4 810 | 3 123 | 0.5 | 54 | |
| West Africa | 1 557 | 2 287 | 0.1 | ‑32 | 5 241 | 5 552 | 0.5 | ‑6 | |
| Central, East and Southern Africa | 8 518 | 7 962 | 0.8 | 7 | 1 141 | 2 673 | 0.1 | ‑57 | |
| America | 133 247 | 131 603 | 12.6 | 1 | 53 366 | 50 159 | 5.3 | 6 | |
| North America | 112 203 | 108 992 | 10.6 | 3 | 40 877 | 42 354 | 4.1 | ‑3 | |
| Central and South America | 21 044 | 22 610 | 2.0 | ‑7 | 12 489 | 7 806 | 1.2 | 60 | |
| Asia | 119 334 | 115 157 | 11.3 | 4 | 97 450 | 101 756 | 9.7 | ‑4 | |
| Middle- and Near East | 20 484 | 18 891 | 1.9 | 8 | 6 804 | 6 097 | 0.7 | 12 | |
| Other countries in Asia | 98 850 | 96 267 | 9.4 | 3 | 90 646 | 95 659 | 9.0 | ‑5 | |
| Oceania and Antarctica | 12 392 | 11 010 | 1.2 | 13 | 2 459 | 4 987 | 0.2 | ‑51 | |
Exports of iron ore and concentrates decreased by 30 percent
Exports of machinery and transport equipment increased by 1 percent. Exports of wood and paper products fell by 3 percent, while chemicals/ rubber products increased by 1 percent. Exports of minerals fell by 5 percent. Within this product area exports of iron ore and concentrates decreased by 30 percent. Within the other products area, food/beverages/tobacco decreased by 2 percent.
Imports of passenger cars fell by 17 percent
Imports of machinery and transport equipment decreased by 3 percent. Within this product area, imports of passenger cars fell by 17 percent. Imports of wood and paper products remained the same, while imports of minerals decreased by 1 percent. Imports of mineral fuels and electric current fell by 6 percent. Within the other products area, imports of food/beverages/tobacco remained the same.
Next publishing will be
2024-11-28 at 08:00.
Statistical Database
More information is available in the Statistical Database
Feel free to use the facts from this statistical news but remember to state Source: Statistics Sweden.