Greenhouse gas emissions from Swedish consumption increase in 2021. Corrected 2023-10-11
Greenhouse gas emissions from Swedish consumption increased in 2021
Statistical news from Statistics Sweden 2023-09-28 8.00
Greenhouse gas emissions from Swedish consumption increase by 9 percent in 2021 compared to 2020. Over 90 percent of the increase comes from emissions embedded in products imported to Sweden.
– Our calculations show that greenhouse gas emissions from Swedish consumption increase in 2021 by 7 million tonnes of carbon dioxide equivalents compared to the year before. This follows a decrease of 10 million tonnes between 2019 and 2020, partly due to the corona pandemic. The emissions increase in 2021 arises predominantly from investments in buildings and machinery and household expenditure on housing and transport, says Annika Damm, analyst at Statistics Sweden environmental accounts.
Sweden’s consumption-based emissions amount to 88 million tonnes of carbon dioxide equivalents in 2021. Over the same period, Sweden’s domestic final demand[1] increase in monetary terms by 5.7 percent. In conjunction with this, the emissions intensity (emissions per Swedish crown of demand) of Sweden’s consumption increases by 3 percent.
The corona pandemic had significant effects on the economy. In spite of the increase compared with 2020, Sweden’s consumption-based greenhouse gas emissions in 2021 are three percent lower than in 2019, the last full year before the onset of the corona pandemic. The emissions intensity in 2021 is seven percent lower than in 2019.
[1] household consumption, public consumption and investment
Source: Statistics Sweden
Source: Statistics Sweden
Source: Statistics Sweden
Greenhouse gas emissions from consumption in 2021 in brief
The increase in greenhouse gas emissions in 2021 arises principally for investment and household consumption. The percentages below are compared with the same value for 2020, unless stated otherwise. The emissions are of greenhouse gases, measured in megatonnes of carbon dioxide equivalents, unless stated otherwise.
- Greenhouse gas emissions embedded in Sweden’s investment increase by 3.4 megatonnes, 15 percent. The increase arises principally for investments in manufactured products (vehicles and other machines) and buildings.
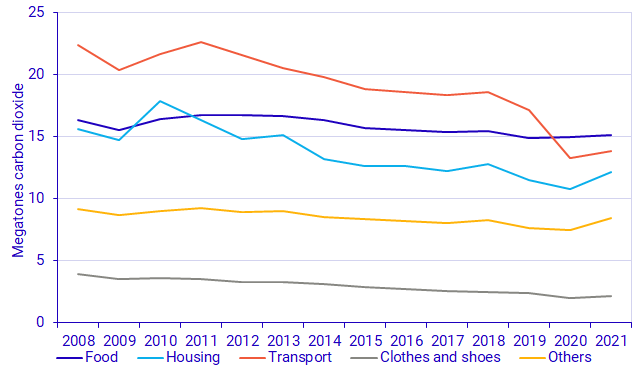
- Greenhouse gas emissions embedded in household consumption increase by 3.1 megatonnes, 6 percent. Emissions increase for all areas of household consumption:
- Housing: 1.3 megatonnes, 12 percent
- Transport: 0.6 megatonnes, 4 percent
- Clothes and shoes: 0.19 megatonnes, 9 percent
- Food: 0.13 megatonnes, 1 percent
- Others: 0.9 megatonnes, 12 percent
- Greenhouse gas emissions embedded in imported products increases by 6.6 megatonnes, over 90 percent of the total increase in Sweden’s consumption-based greenhouse gas emissions. Embedded emissions increase for all countries and regions whose products are included in Sweden’s imports:
- EU countries (plus Norway, Switzerland and the United Kingdom): 2.3 megatonnes, 10 percent
- China: 1.9 megatonnes, 27 percent
- India – 0.3 megatonnes, 25 percent
- Russia – 0.46 megatonnes, 11 percent
- USA – 0.2 megatonnes, 11 percent
- Other countries and regions – 1.4 megatonnes, 11 percent
- Direct emissions from Swedish production and households increase by 0.4 megatonnes, 1 percent
Source: Statistics Sweden
Source: Statistics Sweden
Revisions
For this publication, revisions have been implemented in source data used in statistics production. This leads to time series differences compared to earlier publications of this statistics product.
Revisions in the National Accounts
For each yearly publication, revisions are made to the entire time series for the National Accounts statistics on production, intermediate use, final demand and foreign trade in Sweden’s economy. More information about the revisions can be found here (in Swedish):
Kvalitetsdeklaration Nationalräkenskaper, kvartals- och årsberäkningar, 2023 kvartal, 2021 år
Revisions in input data: air emissions from Swedish production and households
The following revisions have been applied for the calculation of Sweden’s production-based air emissions (a data source for this statistics):
- Greenhouse gas emissions in carbon dioxide equivalents have been calculated from the absolute emissions of each substance according to the global warming potential (GWP) factors used in the IPCC’s fifth assessment report, compared to those used in the previous publication that came from the IPCC’s fourth assessment report. This affects the greenhouse gas emissions that are assigned to methane (CH4) and dinitrogen oxide (N2O, laughing gas)
- Emissions from H50 maritime transport for year 2018 forward have been revised to follow the development in Transport Analysis’ time series on vessels entering Swedish ports.
Statististics on Shipping goods
Revisions for environmental pressures from imported products
Statistics Sweden uses the global multi-regional input-output database EXIOBASE to calculate emissions from Sweden’s imported products.
SCB uses the global multiregional input output database EXIOBASE to estimate emissions arising due to Sweden’s imports. The database is developed and maintained by a consortium led by the Norwegian University of Science and Technology.
For the production year 2022, EXIOBASE version 3.8.2 has been used. More information on EXIOBASE is available here:
For the reference year 2021 multipliers for emissions embodied in Sweden’s import products from EXIOBASE have been imputed from 2020. This is because EXIOBASE has not been updated to take account of effects of the Corona pandemic for 2021. In conjunction with this, national accounts data for total final demand in Sweden for 2021 in fixed prices has been used for this calculation.
Results of revisions
These revisions affect the overall emissions levels. For Sweden´s consumption-based emissions arising from Swedish production, the revisions have led to an average absolute difference between production year 2023 and production year 2022 of 142 kilotonnes carbon dioxide equivalents. This amounts to 0.4 percent of the total emissions from domestic production on average. The time series profile is however largely unchanged due to the revisions.
For Sweden’s consumption-based emissions from imported products, the revisions contribute to an average absolute difference between production year 2023 and production year 2022 of 1346 kilotonnes carbon dioxide equivalents. This amounts to 2.2 percent of the total emissions from imported production on average. The time series profile is also largely unchanged due to the revisions.
Definitions and explanations
These statistics form part of the environmental accounts. The Environmental Accounts are based on the National Accounts and present national environmental statistics and economic statistics in a common framework. Environmental data is systematised according to the same industry classification and areas for final use as economic data. The main goal of this systematisation is to analyse the relationship between economic and environmental performance.
The National Accounts measure gross domestic product in two different ways – from a supply perspective and from a demand perspective. The environmental accounts also measure the gross domestic product, but from an environmental perspective. Where the production perspective answers the question – “who is emitting?”, the consumption perspective answers the question “who benefits from the emissions?”
The method used to produce these statistics is based on environmentally extended input-output analysis, using the framework of the national accounts. This approach is based on the results of a recently completed research project, PRINCE (Policy Relevant Indicators for Consumption and Environment):
See also:
Statistics on environmental pressure from consumption show environmental pressure in relation to the macroeconomic balancing equation that is the basis for the national accounts. The equation for Sweden’s balance is as follows:
P +M = C + G +I+ E (equation 1)
in which P is Sweden’s GDP, M are total imports to Sweden, C is household consumption, G is general government consumption, I is gross capital formation, and E is total export to other countries from Sweden. According to the system of national accounts, all variables are presented in monetary terms. The statistics presented in this publication show greenhouse gas and other air emissions for each term in the equation. For each term, the environmental pressure is allocated to over 40 different product groups.
For household consumption, environmental pressure is presented according to the international COICOP allocation (classification of individual consumption by purpose).
Relationship to other official emissions statistics
Official statistics on greenhouse gas and other air emissions are presented from three complementary perspectives:
- From Sweden’s economy with a consumption perspective (these statistics)
- From Sweden’s economy with a production perspective
- From Sweden’s territory (territorial statistics)
Statistics Sweden is responsible for statistics with a production and consumption perspective, as a part of the system of environmental economic accounts. Statistics with a consumption perspective are unique since they present environmental pressure for all goods and services that are produced and used in the Swedish economy along their entire production chain. This is particularly interesting for Sweden since a large proportion of goods and services that are used in the Swedish economy are imported. Sweden also exports a large proportion of the domestic production.
Environmental accounts’ official statistics from a production perspective present greenhouse gas and other air emissions from the Swedish economy’s total domestic production of goods and services by sector. This system boundary represents the P-term in Equation 1 above and includes Swedish economic actors’ environmental pressure irrespective of where in the world the pressure occurs.
The Swedish Environmental Protection Agency produces official territorial statistics, presenting those environmental pressures that occur within Sweden’s borders.
All of the statistics mentioned are included in Sweden’s official statistics and they follow uniform guidelines for when and how the statistics are published, quality assurance, and documentation.
Results differ between different official statistics
The different system boundaries that are applied in the production of statistics from the three different perspectives lead to differences in the absolute emissions levels as shown in the statistics. Air emissions from a production perspective include virtually all air emissions included in territorial statistics, as well as emissions from international transport operated by Swedish economic actors. Therefore, emissions from a production perspective are in practice greater than emissions from a territorial perspective, which exclude emissions from international transport.
Sweden’s imports and exports are almost exactly balanced, with exports being slightly greater. At the same time, the greenhouse gas emissions intensity (emissions per unit production in monetary terms) for domestic production is lower in Sweden than in Sweden’s major trading partners. This means that greenhouse gas emissions presented in statistics with a consumption perspective are larger than in statistics with a production perspective, even when emissions from Sweden’s export are excluded.
The different official statistics can also be used for different purposes. Statistics from environmental accounts can be used to support policy analyses from an economic and environmental perspective, or investment and procurement decisions.
Territorial statistics are used to follow the development of emissions in relation to climate change goals in Sweden, the European Union and the United Nations. These statistics show which emissions sources are present in the country. Countries therefore have significant jurisdiction over laws and regulations that can affect emissions and can easily perform calculations of national reduction targets.
More information about the different perspectives
Statistics Sweden, environmental accounts’ air emissions accounts:
System of Environmental and Economic Accounts
Statistics Sweden, environmental accounts’ environmental pressures from consumption:
The Swedish Environmental Protection Agency and Statistics Sweden’s joint description of the statistics (in Swedish):
Tre sätt att beräkna klimatpåverkande utsläpp
Glossary of selected terms
Household consumption
Consumption by households and private citizens. Includes non-profit institutions serving households (NPISH).
General government consumption
Consumption by state, county and municipal authorities.
Investments
Investments by general government and industry, for example procurement of machines, buildings and roads. Investments can be subdivided into gross fixed capital formation, changes in inventories and the net acquisition of valuables.
Export
Foreign actors’ use of goods and services arising from Swedish production.
Final consumption/demand/use
Terms used interchangeably for the sum of general government consumption, household consumption, investment and export. “Final” refers to the fact that it is not used in the production chain, rather it is the end of the production chain.
Component
A part of final use, for example for household consumption or export. Each component generates emissions in Sweden and abroad due to import for final use and imports to be used domestically for the production of other goods and services.
Emissions from consumption, consumption perspective
Emissions arising from the consumption of goods and services in Sweden and abroad due to imports.
Emissions from production, production perspective
Emissions arising from the production of goods and services in the economy.
Next publishing will be
The next publication of statistics on environmental pressures from consumption will be in September 2024.
Statistical Database
More information is available in the Statistical Database
Feel free to use the facts from this statistical news but remember to state Source: Statistics Sweden.